Dec 14 Continuous Spotlight | Meet Natale Vinto By CD Foundation Blog, Community Meet Natale Vinto, a member of our awesome Continuous Delivery Community!Read More
Nov 29 Autodesk’s Approach to Continuous Delivery By CD Foundation Blog, Community, Staff Read the latest CDF User Story by Autodesk to learn how they streamline global Continuous DeliveryRead More
Nov 16 FOSDEM 2024: CFP Open [Testing and Continuous Delivery Developer Room] By CD Foundation Blog, Community Submit your talk proposal for the Testing and Continuous Delivery Devroom at FOSDEM 2024 by Deecember 10, 2023.Read More
Nov 14 Continuous Spotlight | Meet Tiffany Jachja By CD Foundation Blog, Community Meet Tiffany Jachja, a member of our awesome Continuous Delivery Community!Read More
Oct 25 Call for cdCon 2024 Program Committee Members By CD Foundation Blog, Community, Staff Apply to be on the Program Committee for cdCon 2024 in Seattle. Deadline to apply is November 15, 2023.Read More
Oct 10 CD Mini Summit 2023 – Wrap Up By CD Foundation Blog, Community Missed the CD Mini Summit in Bilbao? Read the event wrap up and watch the recordings.Read More
Jun 13 Optimizing Your Development Team: Using Real Data to Focus on Real Value By CD Foundation Blog, Community "The 2023 State of Continuous Delivery Report provides a wealth of information and helpful analysis." Find out why.Read More
Jun 01 cdCon + GitOpsCon: Co-evolving Open Source DevOps Communities In One Conference By CD Foundation Blog, Community A nice community recap about CD Foundation and OpenGitOps joining forces in Vancouver to create cdCon + GitOpsCon for a conference about the future of DevOps tools and best practices.Read More
May 09 Key Findings: State of CD Report 2023 By CD Foundation Blog, Community Here are some key findings from the State of Continuous Delivery Report 2023Read More
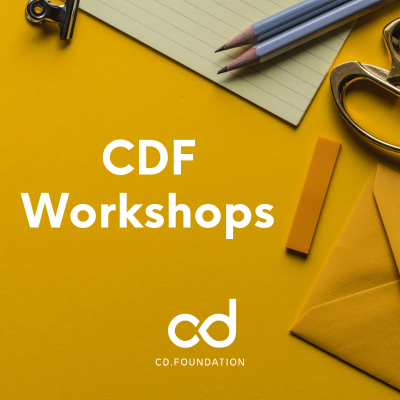
May 07 Announcing CDF Workshops By CD Foundation Blog, Community Launching the quarterly Continuous Delivery Foundation Workshop Series, uniting contributors to projects within the CDF community.Read More