Jan 22 DevOps & Software Delivery Predictions for 2021 By tracymiranda Blog, Staff Here are five developer-focused predictions in the DevOps/software delivery space for 2021Read More
Jan 21 cdCon 2021 – Call for Papers By CD Foundation Blog, Staff Submit your talk proposal for cdCon by March 5, 2021.Read More
Jan 20 Jenkins X: New Features in the Pipelines Visualizer UI By CD Foundation Blog, Staff Here's an overview of the recent new features in the pipelines visualizer UI.Read More
Jan 19 CDF SIG Interoperability 2020: Year in Review By CD Foundation Blog, Staff The formation of the Interoperability SIG was approved in January 2020; this week marks the SIG's first year anniversary!🎉Read More
Jan 18 CDF Newsletter: 2020 Content History By CD Foundation Blog, Staff In 2020, we launched the CDF Newsletter. Find out which one was the most popular and read the ones you missed.Read More
Jan 11 Google Summer of Code 2021: Call for Project Ideas and Mentors By CD Foundation Blog, Staff Have a project idea for GSoC 2021? Submit it by February 19, 2021.Read More
Jan 07 Could CI/CD tool TeamCity really have been exploited to hack the US? By tracymiranda Blog, Staff Yesterday the New York Times ran a story stating that TeamCity, a CI/CD tool from JetBrains, was implicated in the US hacking of 10 federal agencies that in turn affected…Read More
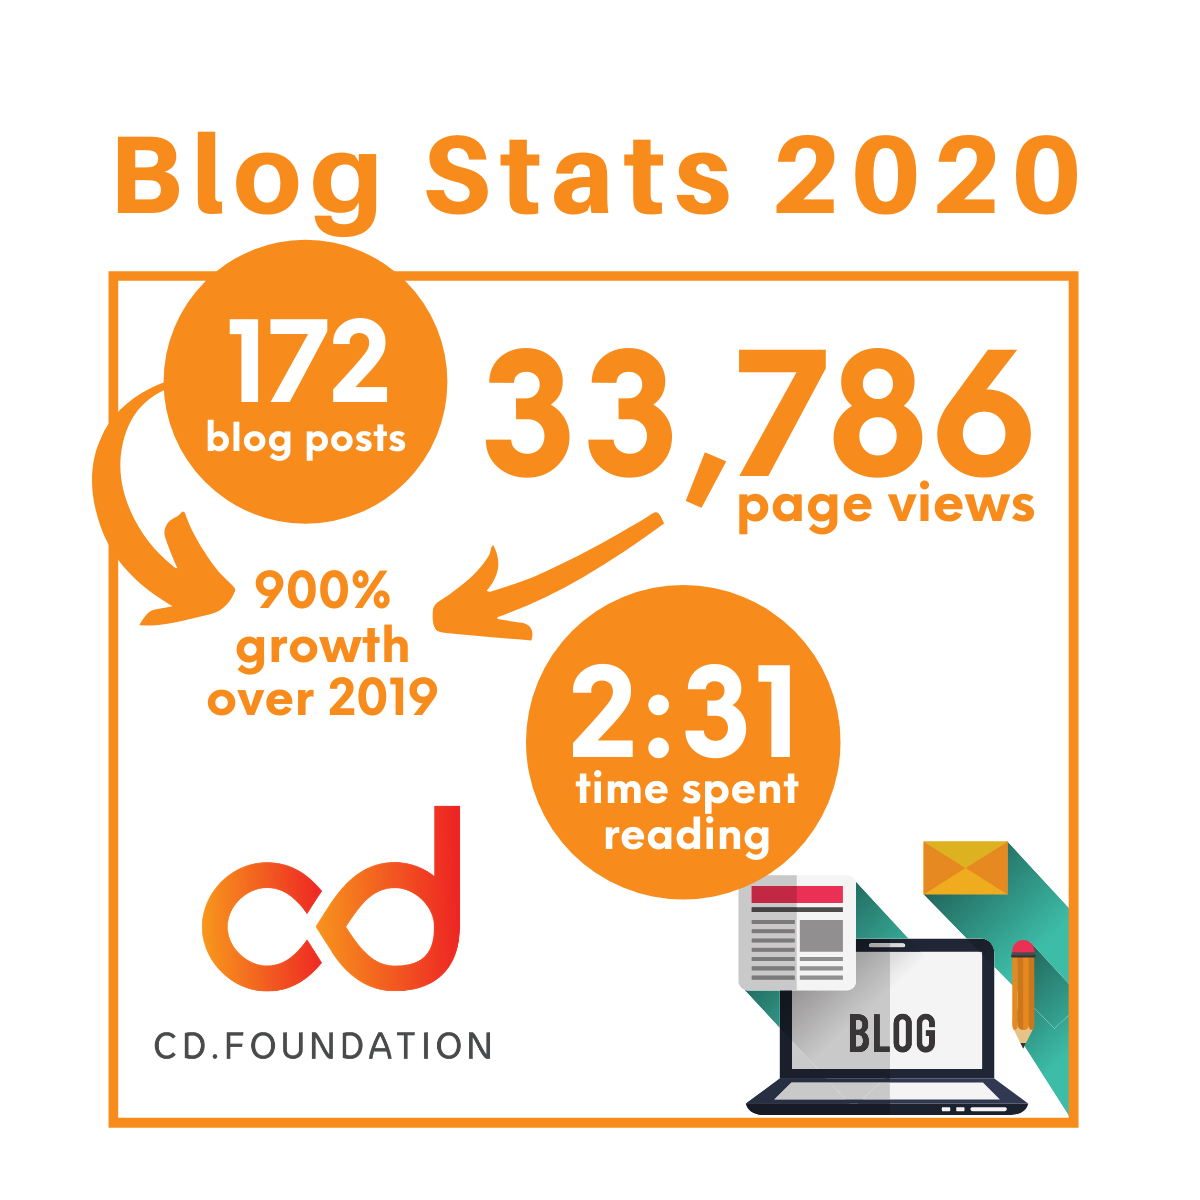
Dec 29 Top 5 CDF Blog Posts of 2020 By CD Foundation Blog, Staff The CDF blog has grown so much in 2020, with 172 new posts! Check out the top 5 and all the stats.Read More
Dec 28 Diversity & Inclusion Group: (she)DF By jsalinas Blog, Staff Join the (she)DF; a safe space for all women to discuss industry topics, share their expertise, employment opportunities, and network.Read More
Dec 22 Extending Jenkins with Spinnaker for a Multi-Target World By CD Foundation Blog, Project Learn how to save time by using Jenkins and deploying with Spinnaker.Read More