

Originally posted on the Spinnaker Community blog, by Rob Zienert, Sr Software Engineer @ Netflix
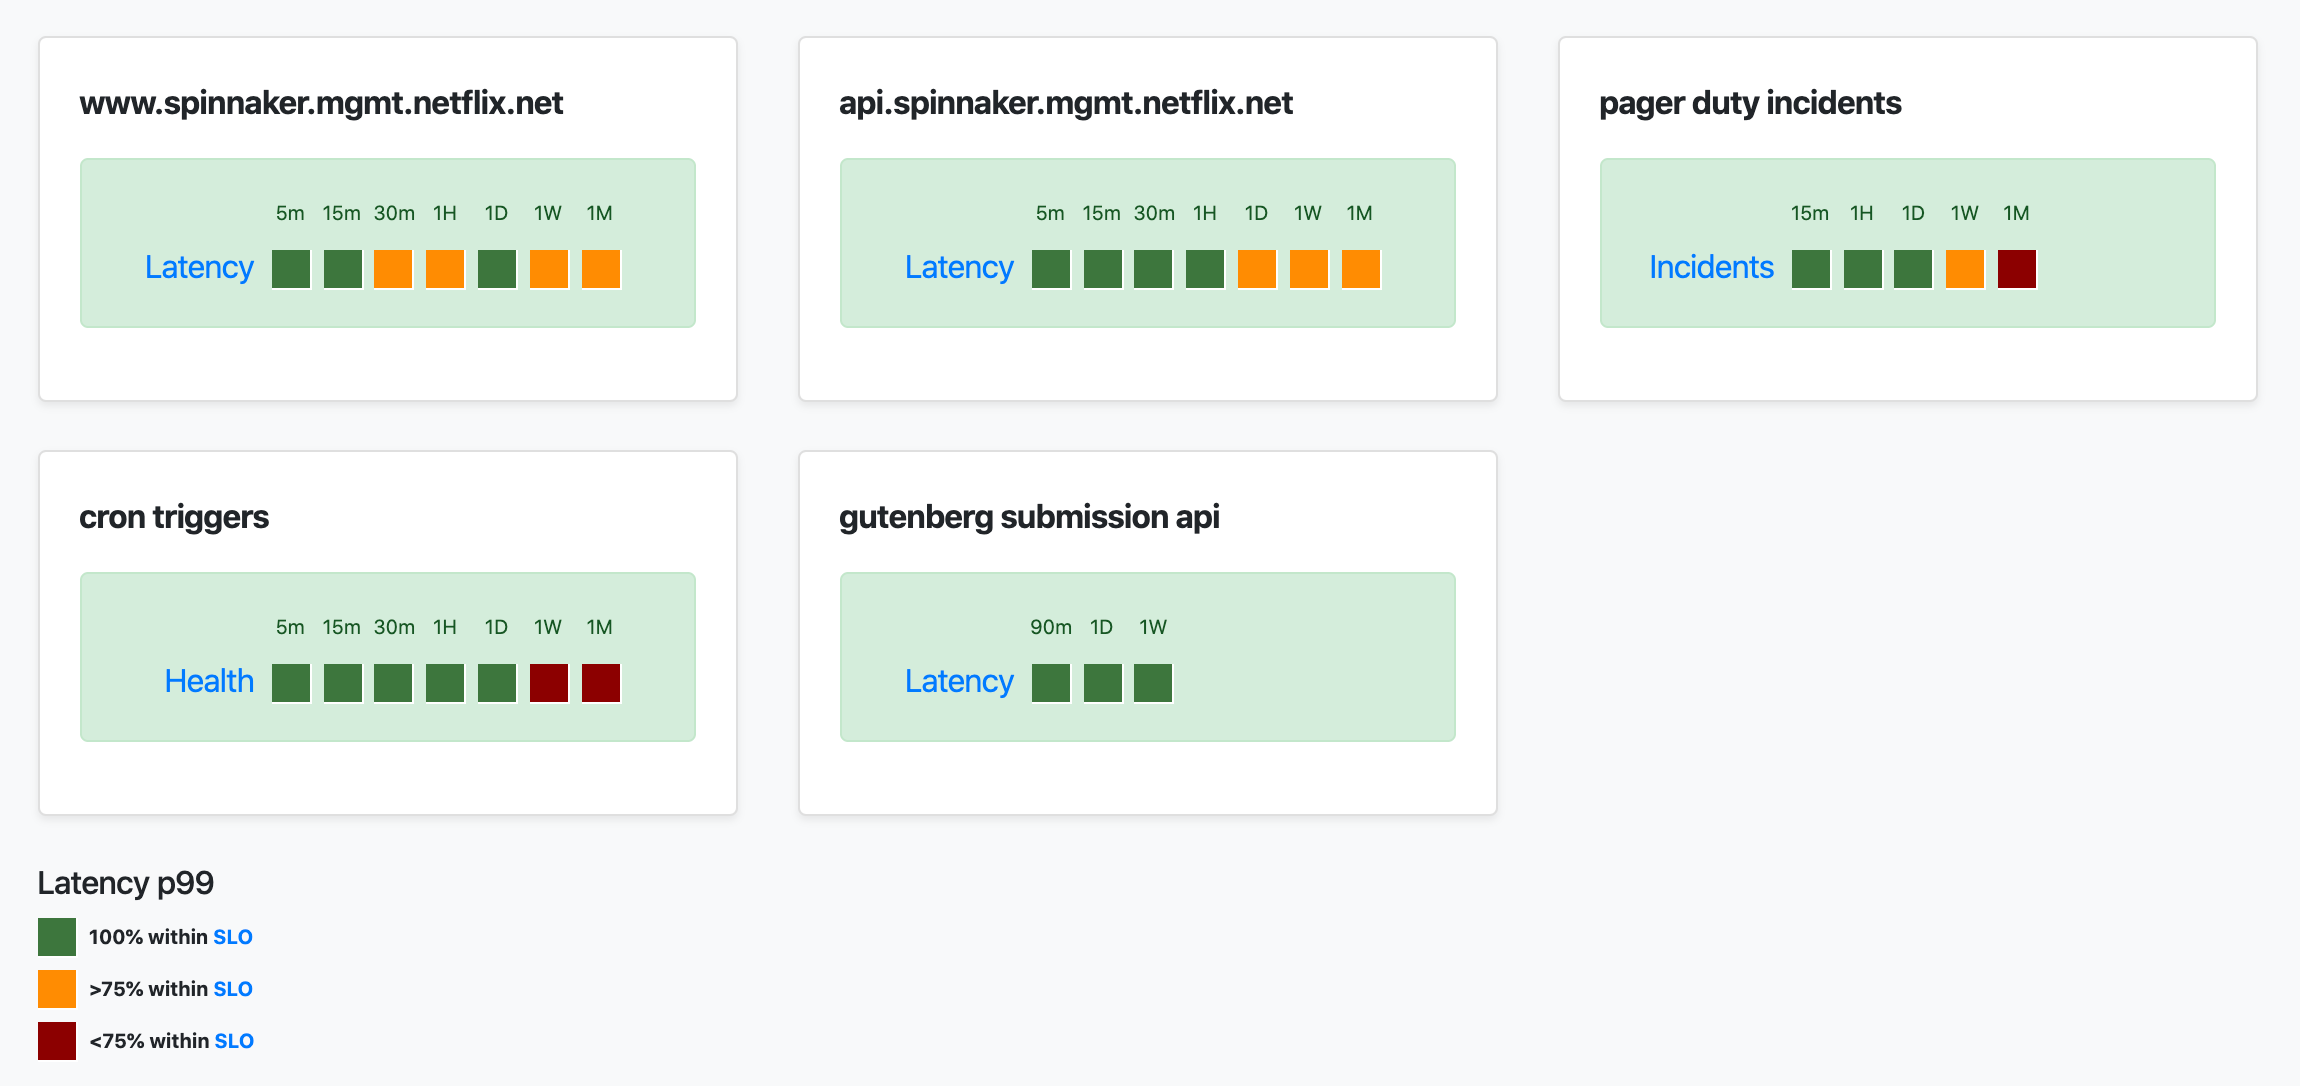
Long, long ago, in an internet that I barely remember, I wrote about monitoring Orca. I haven’t managed to take the time to write another post about a specific service — it’s a lot of work! Instead of going deep this time around, I want to paint with broader strokes: What are the key metrics we can track that help quickly answer the question, “Is Spinnaker healthy?”
Spinnaker is comprised of about a dozen open source services that may vary widely based on configuration, and as such, there’s no singular metric to rule them all. This makes the question, “Is Spinnaker healthy?” a particularly bothersome question since not all services are equally important. If Igor — the service that is responsible for monitoring CI/SCM systems — is unable to communicate with Jenkins, Spinnaker will be in a degraded state, but its core behavior is still healthy. Should Orca’s queue processing drop to zero, however, it’s time to have an elevated heart rate and quick remedy.
Service Metrics
The Service Level Indicators for our individual services can vary depending on configuration. For example, Clouddriver has cloud provider-specific metrics that should be tracked in addition to its core metrics. For the sake of this post’s length, I won’t be going into any cloud-specific metrics.
Universal Metrics
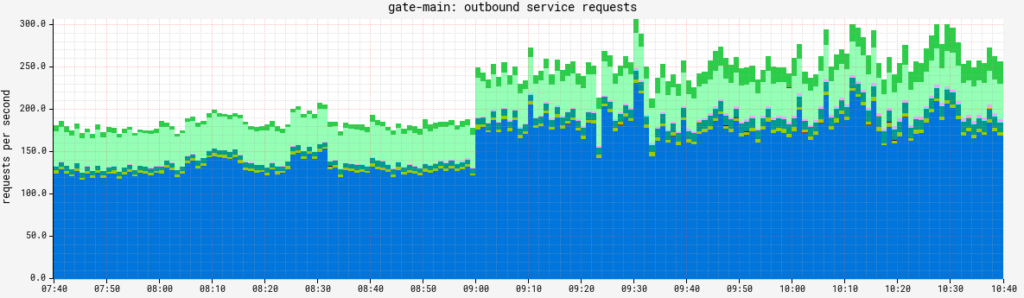
All Spinnaker services are RPC-based, and as such, the reliability of requests inbound and outbound are supremely important: If the services can’t talk to each other reliably, someone will be having a poor experience.
For each service, a controller.invocations metric is emitted, which is a PercentileTimer including the following tags:
status: The HTTP status code family,2xx, 3xx, 4xx...statusCode: The actual HTTP status code value,204, 302, 429...success: If the request is considered successful. There’s nuance here in the4xxrange, but2xxand3xxare definitely all successful, whereas5xxdefinitely are notcontroller: The Spring Controller class that served this requestmethod: The Spring Controller method name, NOT the HTTP method
Similarly, each service also emits metrics for each RPC client that is configured via okhttp.requests. That is, Orca will have a variety of metrics for its Echo client, as well as its Clouddriver client. This metric has the following tags:
status: The HTTP status code family,2xx, 3xx, 4xx...statusCode: The actual HTTP status code value,204, 302, 429...success: If the request is considered successfulauthenticated: Whether or not the request was authenticated or anonymous (if Fiat is disabled, this is alwaysfalse)requestHost: The DNS name of the client. Depending on your topology, some services may have more than one client to a particular service (like Igor to Jenkins, or Orca to Clouddriver shards).
Having SLOs — and consequentially, alerts — around failure rate (determined via the succcess tag) and latency for both inbound and outbound RPC requests is, in my mind, mandatory across all Spinnaker services.
As a real world example, the alert Netflix uses for Orca to all of its client services is:
nf.cluster,orca-main.*,:re,
name,okhttp.requests,:eq,:and,
status,(,Unknown,5xx,),:in,:and,
statistic,count,:eq,:and,
:sum,
(,nf.cluster,),:by,
0.2,:gt,3,
:rolling-count,3,:ge
So, for people who can’t read Atlas expressions, if we have more than 0.2 failing/unknown RPS to a specific service over 3 minutes, we’ll get an alert.
Service-specific Metrics
Most of our services have an additional metric to judge operational health, but in/out RPC monitoring will go far if you’re just starting out.
- Echo
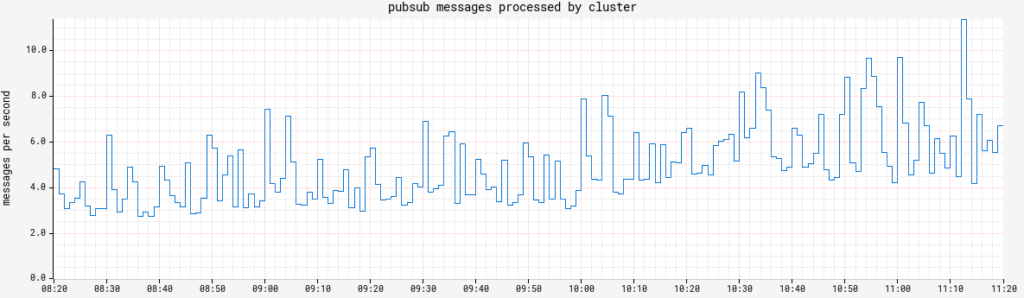
echo.triggers.counttracks the number of CRON-triggered pipeline executions fired. This value should be pretty steady, so any significant deviation is an indicator of something going awry (or the addition/retirement of a customer integration).echo.pubsub.messagesProcessedis important if you have any PubSub triggers. Your mileage may vary, but Netflix can alert if any subscriptions drop to zero for more than a few minutes.
- Orca
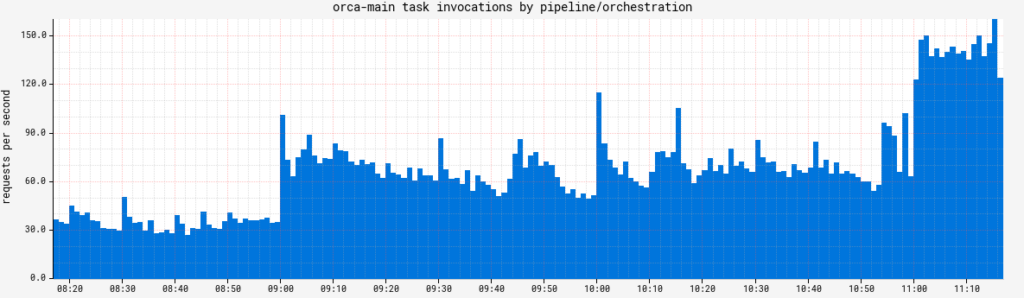
task.invocations.durationtracks how long individual queue tasks take to execute. While it is a Timer, for an SLA Metric, its count is what’s important. This metric’s value can vary widely, but if it drops to zero, it means Orca isn’t processing any new work, so Spinnaker is dead in the water from a core behavior perspective.
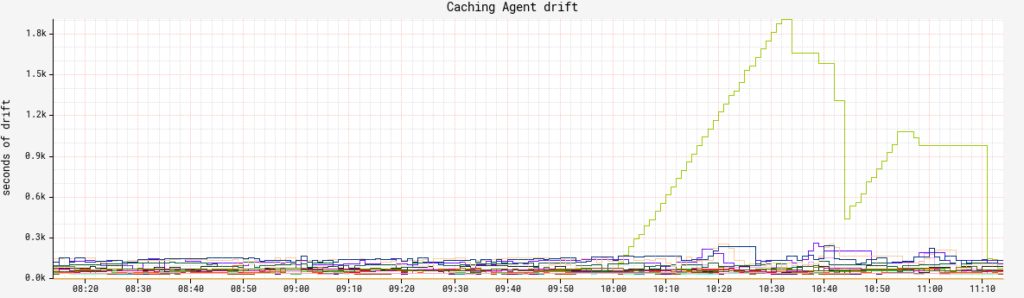
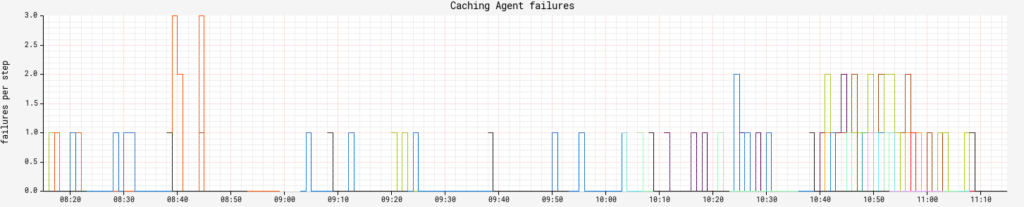
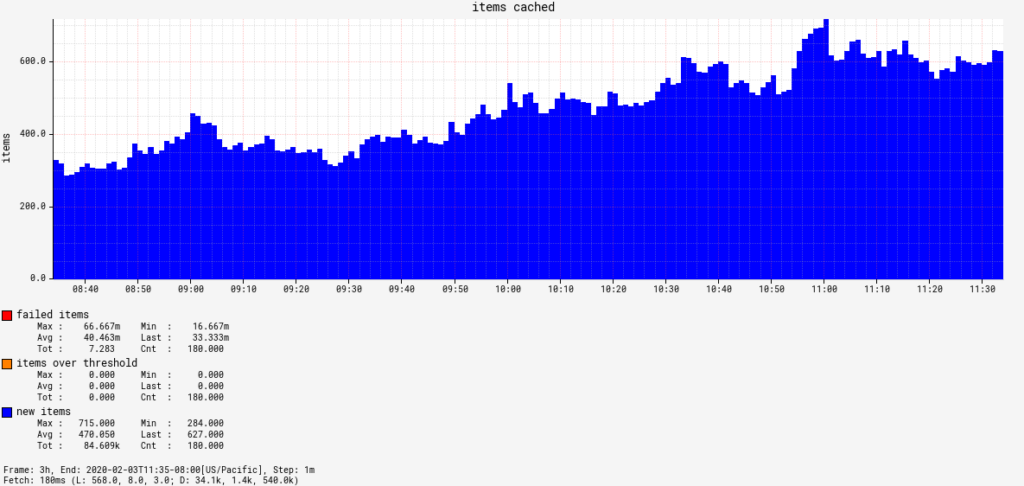
- Clouddriver: Each cloud provider is going to emit its own metrics that can help determine health, but two universal ones I recommend tracking are related to its cache.
cache.drifttracks cache freshness. You should group this byagentandregionto be granular on exactly what cache collection is falling behind. How much lag is acceptable for your org is up to you, but don’t make it zero.executionCounttracks the number of caching agent executions and combined withstatus, we can track how many specific caching agents are failing at any given time.
- Igor
pollingMonitor.failedtracks the failure rate of CI/SCM monitor poll cycles. Any value above 0 is a bad place to be, but is often a result of downstream service availability issues such as Jenkins going offline for maintenance.pollingMonitor.itemsOverThresholdtracks a polling monitor circuit breaker. Any value over 0 is a bad time, because it means the breaker is open for a particular monitor and it requires manual intervention.
Product SLAs at Netflix
We also track specific metrics as they pertain to some of our close internal customers. Some customers care most about latency reading our cloud cache, others have strict requirements in latency and reliability of ad-hoc pipeline executions.
In addition to tracking our own internal metrics for each customer, we also subscribe to our customers’ alerts against Spinnaker. If internal metrics don’t alert us of a problem before our customers are aware something is wrong, we at least don’t want to wait for our customers to tell us.
Continued Observability Improvements
Since Spinnaker is such a large, varied system, blog posts such as these are fine, but really are meant to get the wheels turning on what could be possible. It also highlights a problem with Spinnaker today: A lack of easily discoverable operational insights and knobs. No one should have to rely on a core contributor to distill information like this into a blog post!
There’s already been a start to improving automated service configuration property documentation, but something similar needs to be started for metrics and matching admin APIs as well. A contribution that documents metrics, their tags, purpose and related alerts would be of huge impact to the project and something I’d be happy to mentor on and/or jumpstart.
Of course, if you want to get involved in improving Spinnaker’s operational characteristics, there’s a Special Interest Group for that. We’d love to see you there!