

State of Continuous Delivery Report June 2021
Continuous delivery is a software development practice in which teams release software changes to users safely, quickly and sustainably. Continuous delivery is critical to how teams deliver value. Being able to release small software changes, multiple times a day is a crucial competency for companies in the modern world.
Part of our mission here at the Continuous Delivery Foundation (CDF) is to improve the world’s capacity to deliver software with security and speed. To do so, it is important to have a shared view of where the industry stands in 2021 on key metrics particularly lead time for changes, deployment frequency and time to restore services. We provide further analysis by providing insights into relative performance by industry and programming languages.
We published The State of Continuous Delivery Report that dives deeper into the data. We planned to publish this report every year to track the world’s capacity to deliver software with speed and security.
Current Statistics
We recently commissioned SlashData, a research firm that surveys more than 40,000 developers annually, to develop an exclusive dashboard for use by our community. The dashboard is based on SlashData’s Developer Nation survey, which reached 19,000+ respondents from 155 countries and was carried out between December 2020 and February 2021.
Here’s the current state of Continuous Delivery.
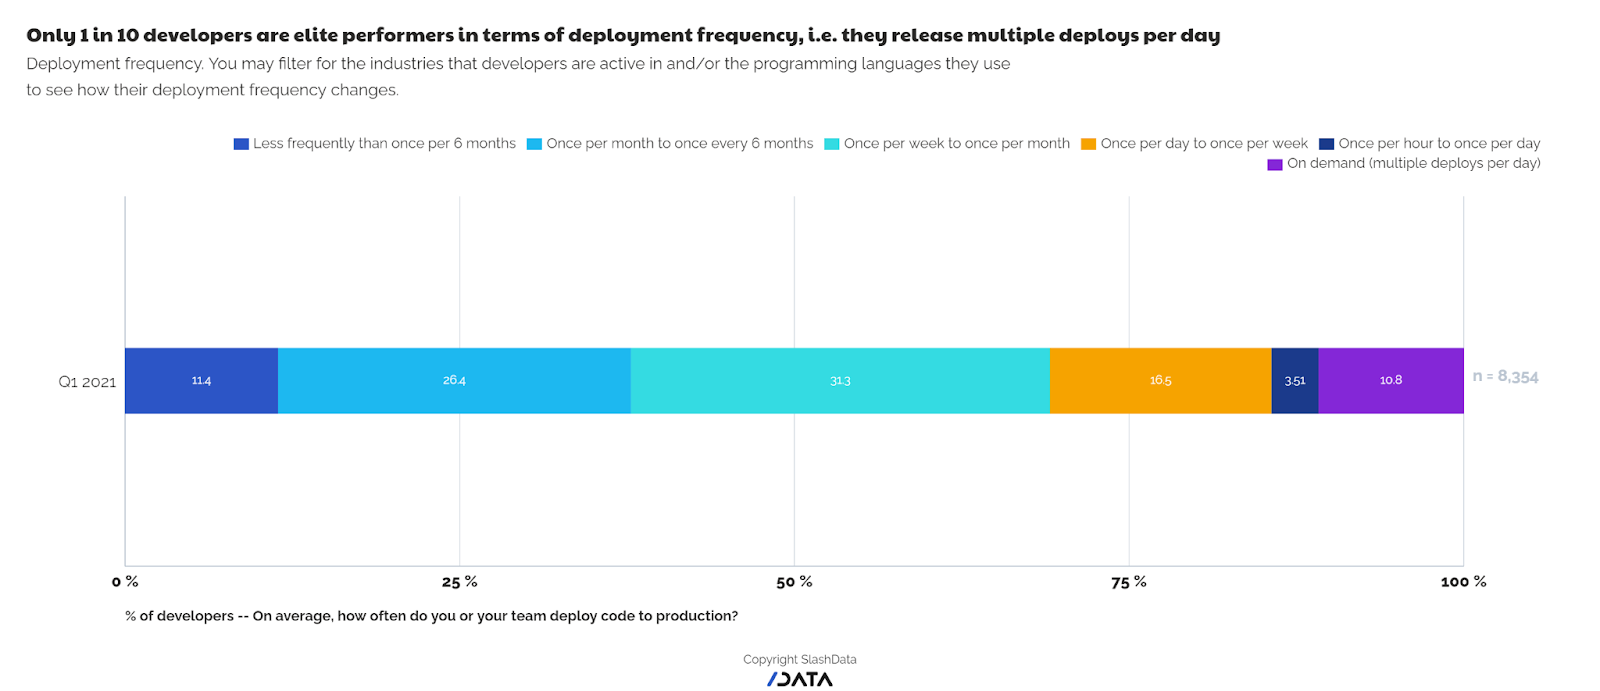
Deployment Frequency
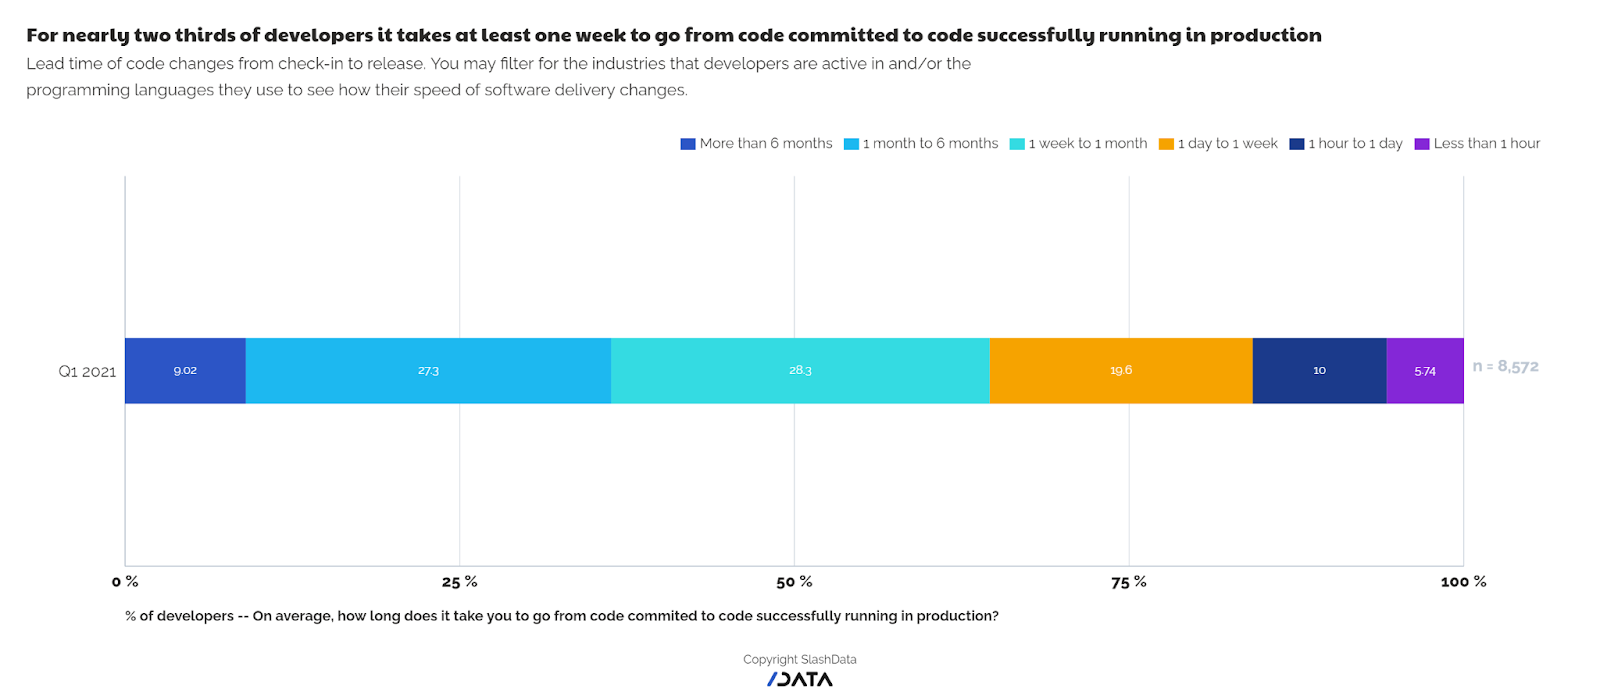
Lead Time for Changes
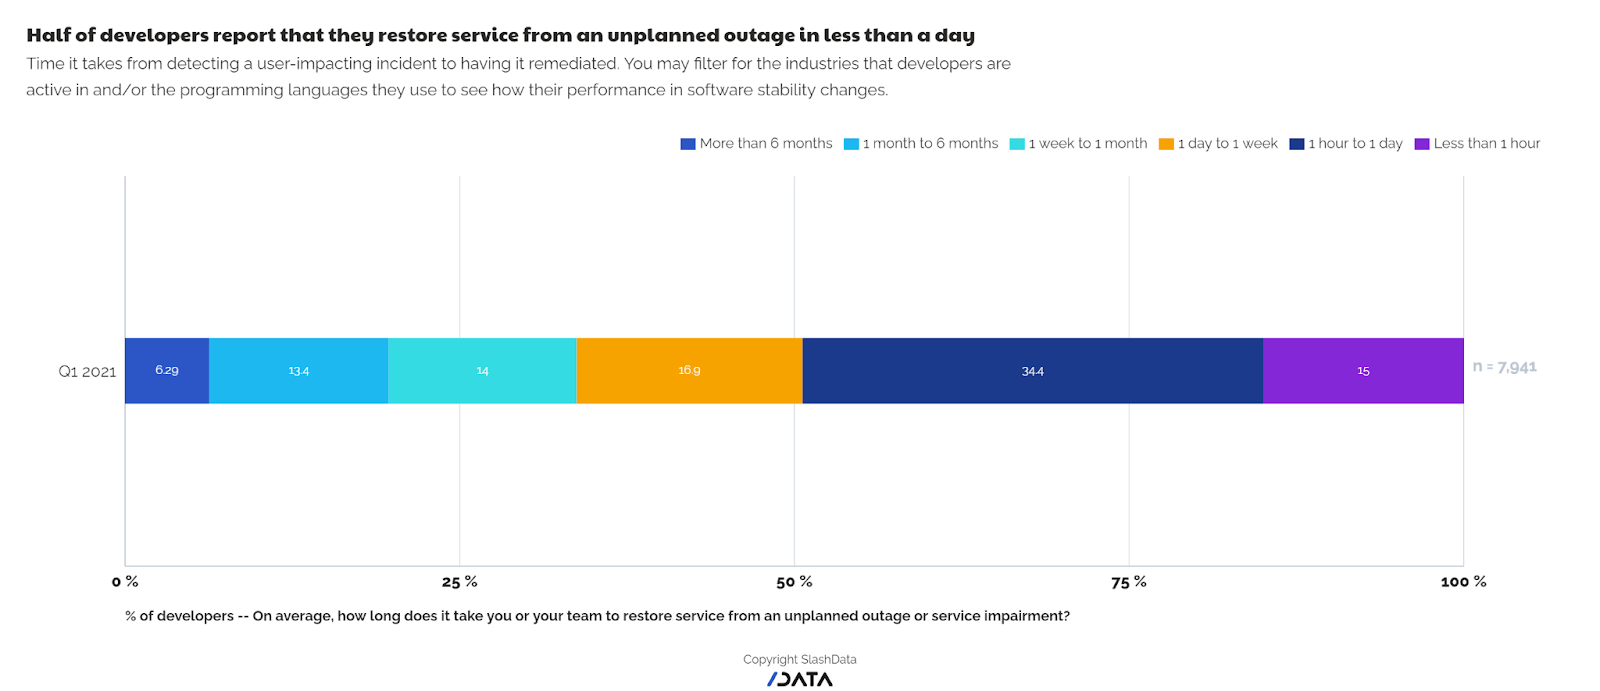
Time to Restore Service
CDF SlashData Dashboard
If you’d like to explore the data on your own, you can access the CDF’s SlashData dashboard by creating an account using this link. Once you’re logged in, you can view the Dashboard and filter the data by programming language and industry.
Share your thoughts
Let us know what you think and what statistics you’re interested in see in the future on GitHub Discussions.