

The answer to: “How do I know when to switch to microservices?”
Read More

Originally posted on the Harness.io blog by Tiffany Jachja (@tiffanyjachja)
In an organization where developers are continuously pushing code to production, managing risks can be difficult. In Measuring and Managing Information Risk: A FAIR Approach, Jack Freund and Jack Jones describe governance as a cost-effective approach to “govern the organization’s risk landscape.” You want to ensure your organization actively understands and manages risk, especially in heavily regulated industries expected to comply with governing authorities and standards, see compliance, or a blog post on measuring compliance.
Governance, risk management, and compliance (GRC) is an umbrella term covering an organization’s approach across these three practices: governance, risk management, and compliance. Freund and Jones describe risk and compliance.
“This [the risk] objective is all about making better-informed risk decisions, which boils down to three things: (1) identifying ‘risks,’ (2) effectively rating and prioritizing ‘risks,’ and (3) making decisions about how to mitigate ‘risks’ that are significant enough to warrant mitigation.”
“Of the three objectives, compliance management is the simplest—at least on the surface. On the surface, compliance is simply a matter of identifying the relevant expectations (e.g., requirements defined by Basel, Payment Card Industry (PCI), SOX, etc.), documenting and reporting on how the organization is (or is not) complying with those expectations, and tracking and reporting on activities to close any gaps.”
So if GRC is about aligning an organization to managing risks, what role do developers play?
We discussed in the previous blog posts the importance of taking a systematic approach to developing software delivery processes. We shared practices like Value Stream Mapping, to give organizations the tools to better understand their value streams and to accelerate their DevOps journey. These DevOps practices indicate that every software delivery stakeholder is responsible for the value they deliver. But on the flip side, they also indicate that stakeholders are responsible for any risks that they create or introduce.
The DevOps Automated Governance Reference Architecture found here, shares how to further adopt a systems approach to delivery.

By looking at each stage in your delivery pipeline, you can define the inputs, outputs, actors, actions, risks, and control points related to that stage.

The essential part of governance is that developers are aware of the risks at each stage. The reference architecture paper shares some of the common risks associated with code commits, such as unapproved changes and PII or credentials in source code. Likewise, for deploying to production, you can have risks such as low-quality code in production, lack of quality gates, and unexpected system behaviors in production.
These risks help define areas of control points that help manage that risk. If you face the risk of unapproved changes, introduce a change approval process. Likewise, you can control risks through secrets management, application quality analysis, quality gate evaluation, and enforced deployment strategies.
Everyone involved in the process from code commits to production is responsible for mitigating risks.
Now let’s discuss the components of a governance process for a cloud environment. The DevOps Automated Governance Reference Architecture, found here, shares an approach to navigating your automated governance journey. Many of these concepts to be discussed here are explained in detail in that reference paper.
Notes are metadata definitions. Occurrences are generated for each artifact or resource that needs this note. As an example, a note could provide details of a specific vulnerability, such as the impacts, names, and status. I would generate an occurrence for every container image with that security vulnerability. Similarly, I could have a note that defines a specific application deployment, as I promote the deployment across different environments, I would generate an occurrence. There is a one to many relationships between notes and occurrences.
An attestation is a particular type of note that represents a verification that you’ve satisfied in your governance process. Attestations are tied to attestors, which hold the authority to verify a control point within your governance process. For example, determining you’ve passed a code review or a unit test is an attestation. Each attestation represents a control point within your governance process.
A binary authorization policy uses a list of attestors to represent your governance as code. A binary auth policy acts as a series of gates so that you can not get to the next stage of your software delivery before getting an attestation from each attestor. Therefore, it’s common practice to turn on binary authorization (BinAuthz) in your Kubernetes environment to ensure you are governing changes and deployments. You’ll have an Admission Controller in your Google Kubernetes Engine(GKE) that does the checks for attestation when you go interact with your environment. Here’s more information on how BinAuthz works for GKE.
If you’d like to learn more about designing control points for your governance process, Captial One also shared their pipeline design through a concept called “16 Gates” in a blog post called “Focusing on the DevOps Pipeline.”
Governance processes require automation to accelerate software delivery; otherwise, it can harm your velocity and time to market. A popular topic to emerge in the past year is automated pipeline governance, which gives enterprises the ability to attest to the integrity of assets in a delivery pipeline. Pipeline governance goes beyond traditional CICD, where developers simply automate delivery without truly mitigating risk. Continuous Integration and Continuous Delivery platforms can help heavily regulated industries manage their governance processes when developers and operations understand the organization’s risks.
Originally posted on the Harness.io blog by Tiffany Jachja (@tiffanyjachja)
Value-stream mapping (VSM) is a lean manufacturing technique popularized in the 90s after its successful applications in the manufacturing industry with companies like Toyota. Since then, DevOps practitioners have shared these processes as it applies to software development. DevOps literature, such as the DevOps Handbook, suggests value stream maps inform the most critical areas of application for DevOps practices and technology. A VSM is also known as a material and information flow map. Using this map, you can identify areas of improvement and map your current state to your future state. If you’d like an in-depth look at VSM, I recommend “Value Stream Mapping: How to Visualize Work and Align Leadership for Organizational Transformation” written by Karen Martin and Mike Osterling. This blog post summarizes the key concepts of VSM and shares how you can use VSM within your IT organization.
In a VSM, three types of flow deliver a product/service to a consumer. The flow of information, the flow of materials, and the flow of time. The flow of information goes from right to left in a VSM. And in contrast, the flow of information and time goes from left to right in a VSM. The illustration below shows the major components of a VSM.
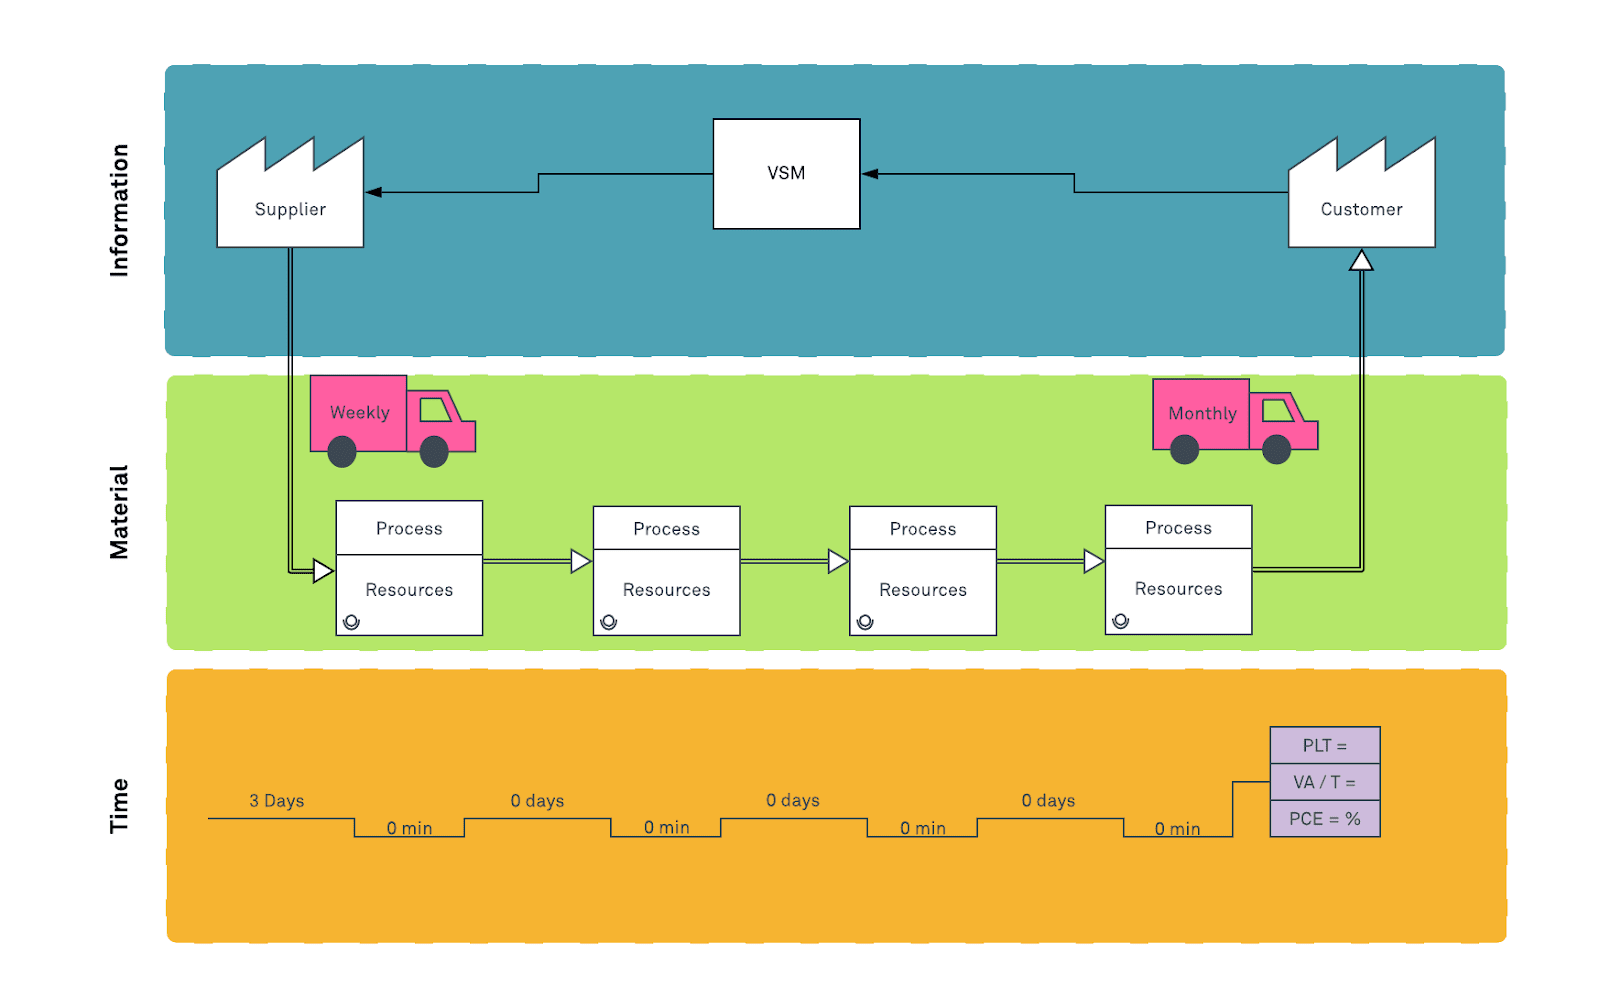
Within the information section, the factory symbol denotes the customer, supplier, and any other entities. All VSMs have a customer and supplier specified. A truck indicates the frequency of delivery. Within the materials section, the process boxes host additional space to include information about the resources needed to complete a particular process. It can be advantageous to also track inventory between processes. This is often denoted by a triangle. We also have the arrows which can denote nonlinear/sequential relationships between processes. Lastly, a VSM has a flow of time to showcase lead times in the flow of materials and information.
These are the major components of a VSM. There may be additional VSM components and symbols that are helpful for more complex value stream exercises. This resource explains those VSM components in more detail.

Example Value Stream Map (edited from a Lucid Chart Template found here).
Here are the steps to creating a value stream map:
Now that we have a VSM let’s discuss how to analyze it. If you are not adding value to your end customer, you are adding to the cost of production. Value stream management practices encourages organizations to focus on the flow of value.
Organizations will look at a Value Stream Map to consider the performance of entire systems. Starting with a single stream of value can help ease other parts of your organization into adopting new ideas and practices.
Flow refers to the flow of work in your value stream. Work can come from features requests, requirements, defects, and or support tickets. The goal is to ensure that the value stream is always moving forward. Some things that can affect flow include:

A book titled Team Topologies authored by Matthew Skelton and Manuel Pais share a few more obstacles to flow. https://teamtopologies.com/
Here is a guide to improving the flow of work within a value stream. It involves creating a dedicated transformation team that’s held “accountable for achieving a clearly defined, measurable, system-level result (e.g., reduce the deployment lead time from “code committed into version control to successfully running in production” by 50%).” This dedicated team should have the resources and freedom to utilize the different DevOps practices to achieve the results.
There are also eight types of waste defined through the lean manufacturing movement. The diagram below describes these types of waste.
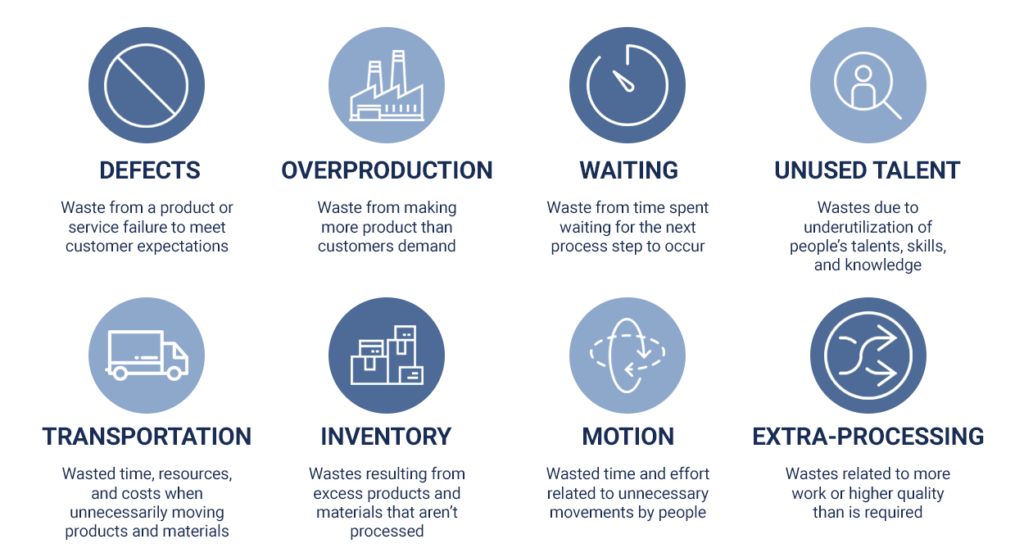
The 8 Types of Waste. (Image source: https://theleanway.net/The-8-Wastes-of-Lean)
If we’d like to minimize in our software delivery processes we need to consider how to manage these findings.
Here are some more ways to look at a Value Stream Maps.
A well-executed VSM workshop gives those in the room the opportunity to champion change. Maybe you’re using an outdated tool for a certain process. A VSM workshop invites critical stakeholders to come and challenges areas of your value stream.
Every organization has a process for delivering their product or service to their customers. Value-stream mapping allows you to optimize your flow of materials and information by lowering costs and improving value adds. This blog posts shares some tips for navigating your DevOps journey through Value stream management techniques such as Value Stream Mapping.
Originally posted on the OpenShift 4.3 blog by Eduardo Arango
Using general available packages (in the form of container images) from an official source or a certified provider comes with a big caveat in relation to performance-sensitive workloads.
These packages may provide ABI compatibility, but they are not optimized for our specialized hardware (like GPUs or high-performance NICs), nor our CPU chip architecture. The best way to address this is to compile your packages (build your images) on your own deployment.
OpenShift provides a way to seamlessly build images based on defined events called BUILDS. A build is the process of transforming input parameters into a resulting object. Most often, the process is used to transform input parameters or source code into a runnable image. A BuildConfig object is the definition of the entire build process.
The missing part to building hardware-specific images is to orchestrate the build process over the different available resources. In this post you will learn about the Node Feature Discovery (NFD) operator and how to tie it to OpenShift builds to have a hardware-specific image build.
The first part describes the NFD operator and how you can use it to manage the detection of hardware features in the cluster. The second part describes how to create an imageStream from a GitHub webhook and how to use the information from the NFD operator to schedule node-specific builds. The third part presents a sample app to test what you have learned.
The Node Feature Discovery Operator (NFD) manages the detection of hardware features and configuration in an OpenShift cluster by labeling the nodes with hardware-specific information. NFD will label the host with node-specific attributes, like PCI cards, kernel, or OS version, and many more. See (Upstream NFD) for more info.
The NFD operator can be found on the Operator Hub by searching for “Node Feature Discovery”:

After following the install steps, you can go to “Installed Operators” in the OpenShift cluster and see:

Inside, a card instructs you to create an instance:

Click on “Create Instance” to get help from the OpenShift web console, which will auto-generate the needed YAML file and allow you to create the object from the console.
Once the NFD operator is deployed, you can go to a node dashboard and check all the Node_labels generated by the operator. Here is a sample excerpt of NFD labels applied to the node:

BuildConfig is a powerful tool in OpenShift. OpenShift Container Platform uses Kubernetes by creating containers from build images and pushing them to a container image registry.
The first step is to create a specific namespace to allocate the builds:
```yaml
apiVersion: v1
kind: Namespace
metadata:
	name: multiarch-build
	labels:
    	openshift.io/cluster-monitoring: "true"
```

For this example, you are pointing the builds to a repository on GitHub. First, you need to generate a secret for the generated GitHub hook:

```yaml
kind: Secret
apiVersion: v1
metadata:
  name: arch-dummy-github-webhook-secret
  namespace: multiarch-build
data:
  WebHookSecretKey: bXVsdGlhcmNoLWJ1aWxk
---
kind: Secret
apiVersion: v1
metadata:
  name: arch-dummy-generic-webhook-secret
  namespace: multiarch-build
data:
  WebHookSecretKey: bXVsdGlhcmNoLWJ1aWxk
```

With the namespace and secret in place, you can now create the imageStream and BuildConfig to continuously watch for user-defined triggers to keep the image up to date. Image streams are part of the OpenShift extension APIs. Image streams are named references to container images. The OpenShift extension resources reference container images indirectly, using image streams.

The following YAML files can be generated via the OpenShift Developer web console. Once you have a generated imageStream and BuildConfig YAML, you need to make sure they look like the following:

```yaml
apiVersion: image.openshift.io/v1
kind: ImageStream
metadata:
  labels:
	app: arch-dummy
  name: arch-dummy
spec: {}
---
kind: BuildConfig
apiVersion: build.openshift.io/v1
metadata:
  name: arch-dummy
  namespace: multiarch-build
  selfLink: >-
	/apis/build.openshift.io/v1/namespaces/multiarch-build/buildconfigs/arch-dummy
  labels:
	app: arch-dummy
	app.kubernetes.io/component: arch-dummy
	app.kubernetes.io/instance: arch-dummy
	app.kubernetes.io/part-of: arch-dummy-app
  annotations:
	app.openshift.io/vcs-ref: master
	app.openshift.io/vcs-uri: 'https://github.com/ArangoGutierrez/Arch-Dummy'
spec:
  nodeSelector:
    node-role.kubernetes.io/worker: ""
    beta.kubernetes.io/arch=amd64
  resources:
	requests:
  	cpu: "100m"
  	memory: "256Mi"
  output:
	to:
  	kind: ImageStreamTag
  	name: 'arch-dummy:latest'
  resources: {}
  successfulBuildsHistoryLimit: 3
  failedBuildsHistoryLimit: 3
  strategy:
	type: Docker
	dockerStrategy:
  	dockerfilePath: build/Dockerfile
  postCommit: {}
  source:
	type: Git
	git:
  	uri: 'https://github.com/ArangoGutierrez/Arch-Dummy'
  	ref: master
	contextDir: /
  triggers:
	- type: ImageChange
  	ImageChange: {}
	- type: GitHub
  	github:
    	secretReference:
      	name: arch-dummy-github-webhook-secret
	- type: ConfigChange
  runPolicy: Parallel
```

There are three lines worth noting in the above YAML (not auto-generated via the Developer web console), where you leverage the NFD operator labels to orchestrate the image builds on top of nodes with specific features, by using the nodeSelector key. For example, only schedule container builds on worker nodes with amd64 architecture:

```yaml
  nodeSelector:
    node-role.kubernetes.io/worker: ""
    beta.kubernetes.io/arch=amd64
```

Now with the BuildConfig created, you can check out the GitHub URL hook:

```bash
[eduardo@fedora-ws image_stream]$ oc describe bc/arch-dummy
Name:   	 arch-dummy
Namespace:    multiarch-build
Created:    5 days ago
Labels:   	 app=arch-dummy
   	 app.kubernetes.io/component=arch-dummy
   	 app.kubernetes.io/instance=arch-dummy
   	 app.kubernetes.io/part-of=arch-dummy-app
Annotations:    app.openshift.io/vcs-ref=master
   	 app.openshift.io/vcs-uri=https://github.com/ArangoGutierrez/Arch-Dummy
Latest Version:    2

Strategy:   	 Docker
URL:   		 https://github.com/ArangoGutierrez/Arch-Dummy
Ref:   		 master
ContextDir:   	 /
Dockerfile Path:    build/Dockerfile
Output to:   	 ImageStreamTag arch-dummy:latest

Build Run Policy:    Serial
Triggered by:   	 Config
Webhook Generic:
    URL:   	 https://api.4.z.y-ed-dev.blog-openshift.devcluster.openshift.com:6443/apis/build.openshift.io/v1/namespaces/multiarch-build/buildconfigs/arch-dummy/webhooks/<secret>/generic
    AllowEnv:    false
Webhook GitHub:
    URL:    https://api.4.z.y-ed-dev.blog-openshift.devcluster.openshift.com:6443/apis/build.openshift.io/v1/namespaces/multiarch-build/buildconfigs/arch-dummy/webhooks/<secret>/github
Builds History Limit:
    Successful:    5
    Failed:   	 5

Build   	 Status   	 Duration    Creation Time
arch-dummy-1     complete     1m37s    	 2020-03-31 17:35:32 -0400 EDT

Events:    <none>

```
With this URL, you can then follow GitHub Webhook instructions for a ready-to-work imageStream..
To learn more about OpenShift Builds and more advanced use cases, you can go here.
To test what you just learned today, you can create a buildConfig of Arch-Dummy as a didactic confirmation that the feature-specific build is working. To do so, deploy the image as detailed on https://learn.openshift.com/introduction/deploying-images/ by selecting the built image “arch-dummy:latest”.
This image was built from the repo https://github.com/ArangoGutierrez/Arch-Dummy as seen in the imageStream.yaml.
This application generates a small API service with three endpoints:
/ -> Will retrieve information about the app
/version -> Will retrieve information about the app binary and where it was built
Example:
/ -> Will retrieve information about the app

/version -> Will retrieve information about the app binary and where it was built
Example:
```json
{Git Commit:"6825a2f2a5b6a60278868260d8cdb51d192d9e63",CPU_arch:"Intel(R) Xeon(R) CPU E5-2686 v4 @",Built:"Tue Mar 31 21:43:15 UTC 2020",Go_version:"go1.12.8 linux/amd64"}
```

/cpu -> will retrieve information about the node on which the app is currently running

```json
{name:"Intel(R) Xeon(R) CPU E5-2686 v4 @ 2.30GHz",model:"79",family:"6"}
```
This dummy arch app will allow you to test whether the image was built correctly and orchestrated correctly.
Building hardware-specific images is easy by leveraging internal OpenShift tooling like imageStreams and coupling with the Node-Feature-Discovery Operator to manage the detection of hardware features and configuration in the OpenShift cluster. OpenShift simplicity allows developers to define the nodeSelector key to orchestrate image builds over target hardware. These could prove to be of great use when you consider image-build processes that involve AI/ML training requiring GPU and other special resources.
On this blog post, you saw a quick example on how to tie together the Node-Feature-Discovery Operator and Openshift imageStreams for simple hardware-specific image builds. The following post goes deeper into OpenShift replacing the imageStream build with OpenShift Pipelines and another operator, the Special-resource-operator, to build more complex images and deploy them in the cluster.

Originally posted on the Armory blog by Chad Tripod
Continuous Delivery and Deployment is changing the way organizations deliver software. Over the years, software delivery has morphed into a time consuming process. With countless validations and approvals to ensure the code is safe to present to users. And with good reason, releasing bad software can severely impact a business’s brand, popularity, and even revenue. In this day and age, with customer sentiment immediately feeding back into public visibility, companies are taking even stricter measures to ensure the best software delivery and user experience.

When deploying software to production, we use words like “resilience” to talk about how the code runs in the wild. For the optimists, we use words such as “Availability Zones,” and for those more pessimistic about deployments, we say, “Failure Domains.” When I was architecting and deploying applications for Apple, eBay, and others, I always built for failure. I was always more interested in how things behave when we break things, and less so on the steady state. I’d relish in unleashing tools like Simian Army to wreak havoc on what we had built to ensure code and experience weren’t impaired.
Nowadays, there is a much better approach to ensuring safety. Continuous Delivery (CD) has enabled organizations to shift left. Empowering developers with access to deploy directly to production, but with the guardrails needed to make sure safety isn’t compromised for speed. Luckily, the world-class engineers at Netflix and Google have built a platform, Spinnaker. Spinnaker addresses deployment resiliency concerns and empowers developers with toolsets to validate and verify as a built-in part of delivering code.

Now, let’s break down the modern model and review the tools available in the CI/CD workflow.
Spinnaker – Spinnaker is a high scale multicloud continuous delivery (CD) tool. While leveraging the years of software delivery best practices that Netflix and Google built into Spinnaker, users get to serialize and automate all the decisions that they have baked into their current software delivery process. Approvals, environments, testing, failures, feature flagging, ticketing, etc., are all completely automated and shared across the whole organization. The end result? Built-in safety that allows DevOps teams to deploy software with great velocity.
Continuous Verification – Leveraging real-time KPIs and log messages to dictate the health of code and environment. Spinnaker’s canary deployments ingest real-time metrics from data platforms including Datadog, NewRelic, Prometheus, Splunk, and Istio into a service called Kayenta. Kayenta runs these time series metrics into the Mann Whitney algorithm developed by Netflix and Google, and compares release metrics to current production metrics. Spinnaker will then adjust or roll back deployments automatically based on success criteria. This allows math and data, rather than manual best-guesses, to dictate in real time if the user is getting the best experience from the service.
Chaos Engineering – Why wait for things to break in production to fix them? There are better ways. Chaos Engineering is the practice of breaking things in pre prod environments to understand how the code behaves when it’s exercised. What happens when a dependent service goes offline? How do the other services in the application behave? How does Kubernetes deal with it? What about shutting off a process in a service? These are the measures Gremlin and Chaos Monkey give your developers. Now testing is much more than what your CI Server does, it takes into consideration the environments in which they are deployed.
Service Mesh – Service Meshes are a Kubernetes traffic management solution. Kubernetes applications can traverse many clusters, regions, and even clouds. Service Meshes are a way to manage traffic flows, traceability, and most importantly with ephemeral workloads, observability. There are many flavors of service meshes to choose from. Istio/Envoy has the most visibility, but you can also implement service meshes from nginx, consul, solo.io or even get enterprise support from companies like F5/NGINX+ or Citrix, which offer elevated ingress features. Service Meshes in the context of software delivery provide a very granular canary release. Instead of blindly sending traffic to a canary version for testing, you can instead programmatically use layer 7 traffic characteristics such as URI, host, query, path, and cookie to steer traffic. This allows you to switch only certain users, business partners, or regions to new versions of software.
DevSecOps – In my years seeing changes in technology and how we deliver software to end users, one thing is for sure: security wants to understand the risks in what you’re doing. And with good reason. Security exploits can leak sensitive information or, even expose an organization to malicious hackers. Luckily this new deployment world allows security to process their scans and validations in an automated fashion. Solutions range from Twistlock, Artifactory Xray, Aqua, Signal Science, etc. There are many DevSecOps solutions, so it is a good thing to know that Spinnaker supports them all!
Spinnaker stages automate developer tools:

End Result – As you put together your new cloud native tool chain, there are many ways you can improve the way you release software. I urge you to deploy the tools you need for the service you are providing, not only based on what a vendor is saying. Over time, implementing guardrails will increase your innovation and time to market. For many this will be a competitive advantage against those who move slowly, and investing in these areas will, over time, improve the hygiene of your software code, which will provide stability in your future releases. By de-risking the release processes and improving safety, the end users are given the best possible experience with your software.

Originally posted on the Armory blog by Rosalind Benoit
Folks in the DevOps community often ask me, “I’m already using Jenkins, so why should I use Spinnaker?” We’re hosting a virtual talk to address the question! Register here to join us 3/26 and learn how Jenkins and Spinnaker cooperate for safe, scalable, maintainable software delivery.
A delivery engineer I spoke with last week said it best:
“I came from a world of using Jenkins to deploy. It’s great but, you’re just modifying Jenkins jobs. It can do a lot, but it’s like that line in Jurassic Park – ‘Your scientists were so preoccupied with whether or not they could, they didn’t stop to think if they should.’”
Many of us came from that world: we built delivery automation with scripts and tools like Jenkins, CircleCI, Bamboo, and TeamCity. We found configuration management, and used Puppet or Ansible to provision infrastructure in our pipelines as code. We became addicted to D.R.Y. (don’t repeat yourself), and there is no looking back.
Jenkins provides approachable automation of continuous integration steps. Spinnaker works with Jenkins to pick up and deliver build artifacts, and to delegate pipeline stages. As a true continuous delivery platform, Spinnaker codifies your unique software delivery culture and processes to your comfort level. It also adds production-ready value to your pipelines:
Jenkins taught us many lessons. It popularized the use of imperative pipelines to execute ordered steps in a SDLC. It taught us that centralizing delivery workflows into one platform makes strategic sense in scaling operations. At the same time, especially when used for deployments, it suffers from instability and maintenance overhead brought by unchecked plugin sprawl. It struggles to offer a scalable model for managing multiple jobs and distributed apps. But the way it consolidated SDLC tasks within a full-featured GUI empowered developer teams to start doing delivery.
In the new world of fast innovation through immutable infrastructure, Spinnaker has adapted that visibility to the realms of cloud and cloud native. It provides a centralized vantage point on all of your ephemerally-packaged applications, in their many variations. Within your pipelines, its guardrails identify invalid or non-compliant infrastructure before deployment even happens. Spinnaker’s smart delivery workflows insulate customers and end-users from impact to their software experience.
This sense of safety is Jenkins’ missing ingredient. Jenkins introduced a world where developers could independently chain together a path to production. It enabled us to improve our efficiency and code quality through testing and build automation, with self-service. This giant technological shift sparked a move away from waterfall development and ITIL-style delivery.
But, culture cannot change overnight. Developers who exercised this newfound power struck terror in the hearts of those accountable for availability and software-driven business goals. Culture lagged behind tooling, sparking fear and risk aversion. That fear still permeates many organizations, allowing baggage-free startups and the most nimble companies to digitally disrupt the status quo. These innovators prove that delivering highly valued interactions through software means increased profit and influence. Enter Armory Spinnaker.
Watch Armory CTO Isaac Mosquera’s Supercharge Your Deployments With Spinnaker and Jenkins presentation at CD Summit, or check out the longer version with Q&A at DeliveryConf.
Stop spending time and talent knitting your toolchain together with pipeline steps that rely on brittle, expensive-to-maintain scripts and repetitive GUI fiddles! Attend “I have Jenkins; why do I need Spinnaker?” to learn more about how Spinnaker can free your developers and evolve your continuous delivery game.

Originally posted on the Armory blog by Rosalind Benoit
I met Edgar Magana at Spinnaker Summit last year, when he spoke during Armory’s keynote as one of six Spinnaker champions. The energy and enthusiasm he brings to advocating for Spinnaker contrasts his intensity in approaching his role as operator of mega-scale cloud infrastructure. But, the more I get to know him, the more I understand that it’s one in the same. To enable Salesforce’s application owners to safely evolve software, he must ensure homogenous, predictable models for continuous delivery. Spinnaker has helped him make that a reality.
“Across multiple environments, we have to enable different models for Spinnaker based on security requirements,” he explains as he shares his standardization strategy.
“We templatize all the pipelines for consistency across services, with two types: EC2 instance deployments, and Kubernetes cluster pipelines. For Kubernetes, we require a lot of security hardening, and we need to use the same logging and monitoring mechanisms for all of our clusters.”
Every time Edgar’s team discovers a new configuration for Kubernetes, they upgrade that pipeline, which should trigger a service owner to relaunch the pipeline with new parameters, or sometimes, destroy their Kubernetes cluster and create a new one. “We make all these changes in development and staging first, of course,” he says, noting the dev, pre-prod, and prod Spinnaker instances his team maintains.
A security requirement that artifacts not be created in the same place that deploys services imposes an added complexity. It required Edgar’s team to innovate further, and split the baking process across two different Spinnaker instances. Luckily, they could configure this out of the box with Spinnaker by overriding parameters; Edgar appreciates that Spinnaker doesn’t hard-code a lot of configuration, as rigidity wouldn’t support Salesforce’s unique requirements. That has also allowed his team to create a “heavy layer of automation on top of Spinnaker,” providing guardrails for application owners.
Our conversation turns to the Spinnaker Ops SIG (Special Interest Group), which Edgar recently founded. A solid kickoff meeting produced several action items to be completed before the next scheduled meeting on February 27th at 10 AM, (always a good sign).
Most importantly at this stage, Edgar says:
“We want to reach out to more operators, people who are either struggling or evaluating Spinnaker. We need operators in different stages — super experts who control everything, like those at Netflix and Airbnb, operators that are getting there, like us at Salesforce, and those in the initial evaluation stage. The goal of the SIG is to have a place where operators can exchange use cases, and have a unified voice, just like other Spinnaker SIGs, and a path for specific features we want incorporated into Spinnaker. The community needed a place to discuss how to operate Spinnaker better. As an operator of large-scale infrastructure, I don’t want to share this system with only a few companies. We want to welcome new users and operators, and facilitate their transition from the POC (proof-of-concept) environment to the real thing. This will help us understand what kinds of features are more important.”
Does the Ops SIG also provide a place to vent and empathize? I sure hope so! “That’s the life of a cloud operations architect,” Edgar says when he has to reschedule our meeting, “we get called all the time, from account issues, to Spinnaker and Kubernetes configuration,” and lots more; indeed, once when I ping Edgar about this blog, he’s in a “war room” (boy, I sure don’t miss my Ops days right now!) But just like Armory, Edgar values empowering developers, and safely pushing control of applications and their infrastructure to the edge to fuel innovation. Better software is worth the hard work!
Another of Edgar’s goals for the Ops SIG: create reference architecture documentation for HA (high availability) and disaster recovery. “I want new users of Spinnaker to say, ‘I don’t need to reinvent the wheel; I’ll just follow these HA guidelines.” Architecture collateral will help Platforms and DevOps teams convince leadership that Spinnaker is a good investment for the company’s continuous delivery of software. This is where Edgar’s warm enthusiasm and operator’s intensity meet: empowering developers, empowering the community, empowering the planet.
I look forward to working more with Edgar and his team at Salesforce as part of the Ops SIG, our April Spinnaker Gardening Days online hackathon, and more. This is the kind of open-source heroism that will usher in the new industrial revolution!
Check out Edgar’s talk on Salesforce & Spinnaker from last winter’s Spinnaker Summit below, or hop over to the registration page for Armory’s upcoming, “I have Jenkins; why do I need Spinnaker?” webinar to reserve your spot!

712:23 PM – Nov 16, 2019Twitter Ads info and privacySee Edgar Magana’s other Tweets
Watch Edgar’s 8 minute talk, part of Isaac Mosquera’s keynote.:

Originally posted on the Armory blog by German Muzquiz
Spinnaker Operator is now Beta!
With Spinnaker Operator, define all the configurations of Spinnaker in native Kubernetes manifest files, as part of the Kubernetes kind “SpinnakerService” defined in its own Custom Resource Definition (CRD). With this approach, you can customize, save, deploy and generally manage Spinnaker configurations in a standard Kubernetes workflow for managing manifests. No need to learn a new CLI like Halyard, or worry about how to run that service.
The Spinnaker Operator has two flavors to choose from, depending on which Spinnaker you want to use: Open Source or Armory Spinnaker.
With the Spinnaker Operator, you can:
Additionally, Spinnaker Operator has some exclusive new features not available with other deployment methods like Halyard:
Let’s look at an example workflow.
Assuming you have stored SpinnakerService manifests under source control, you have a pipeline in Spinnaker to apply these manifests automatically on source control pushes (Spinnaker deploying Spinnaker) and you want to add a new Kubernetes account:
apiVersion: spinnaker.armory.io/v1alpha2
kind: SpinnakerService
metadata:
  name: spinnaker
spec:
  spinnakerConfig:
    config:
      version: 2.17.1   # the version of Spinnaker to be deployed
      persistentStorage:
        persistentStoreType: s3
        s3:
          bucket: acme-spinnaker
          rootFolder: front50
+      providers:
+        kubernetes:
+          enabled: true
+          accounts:
+          - name: kube-staging
+            requiredGroupMembership: []
+            providerVersion: V2
+            permissions: {}
+            dockerRegistries: []
+            configureImagePullSecrets: true
+            cacheThreads: 1
+            namespaces: []
+            omitNamespaces: []
+            kinds: []
+            omitKinds: []
+            customResources: []
+            cachingPolicies: []
+            oAuthScopes: []
+            onlySpinnakerManaged: false
+            kubeconfigFile: encryptedFile:k8s!n:spinnaker-secrets!k:kube-staging-kubeconfig # secret name: spinnaker-secrets, secret key: kube-staging-kubeconfig
+          primaryAccount: kube-staging
We hope that the Spinnaker Operator will make installing, configuring and managing Spinnaker easier and more powerful. We’re enhancing Spinnaker iteratively, and welcome your feedback.
Get OSS Spinnaker Operator (documentation)
Get Armory Spinnaker Operator (documentation)
Interested in learning more about the Spinnaker Operator? Reach out to us here or on Spinnaker Slack – we’d love to chat!

Originally posted on the Armory blog by Andrew Backes
At Armory, we are intensely focused on building our culture, not just building our product. Our culture is the operating system of our company, underpinning and supporting everything that we do.
From the get-go, we decided that Armory’s culture was going to be designed with intentionality to be remote work friendly. Armory is built on Spinnaker, an open source project created by Netflix and Google. One of the incredible features of open source software is that it is built through the collaboration of talented individuals and teams distributed all over the world. To align with the vibrant Spinnaker open source community, we doubled down on building a strong remote work culture. Today, more than half of our company works remotely, with the remainder working at our HQ in San Mateo, CA.
For many companies, the experience of remote workers is a secondary concern, if it is even thought of at all. But remote workers face their own unique experiences, benefits, and challenges. At Armory, we acknowledge and welcome this unique experience, approach it with empathy and understanding, and create feedback mechanisms to ensure that our on-site and remote tribals are all having the best possible experience.
Some of the things we do at Armory include:

A high-risk moment for Armory! Most of the engineering team in one single elevator, on the way to dinner during a 3-day offsite. Everything turned out fine, and dinner was delicious.
All of these initiatives take time and effort. Why do we bother, instead of leaving it up to remote tribals to conform to the working cadence of the tribals who are at HQ?
One simple answer is that it comes down to people. We want to work with the best people all over the world, not just the best people in the Bay Area. And that means embracing remote work and maximizing the remote work experience.
For me personally, my main role as the Head of Engineering is to empower the engineering team. That means creating the visibility and shared context so that engineers have the information that they need to make great decisions to positively impact the company and the Spinnaker community. Furthermore, continual growth and improvement is a core value at Armory. It is imperative that each of us continue to learn and grow, not just in our technical depth but also in understanding how each other work, how we can function as a better, more cohesive team, and how we can strive together for larger goals.
If I am not investing in the right tools, processes, and culture to foster that shared context and continual growth across the entire engineering team, then I am not doing my job.
Armory is hiring polyglot engineers, as well as tribals across the entire organization. Check out open roles and learn more about what life is like at Armory at armory.io/careers. We’d love to hear from you!
