

Contributed by Tim Jacomb, Kainos
Blue Ocean was a project to bring Jenkins’s UI into the modern world with a higher focus on user experience and design than the regular Jenkins UI.
Blue Ocean brought much-needed pipeline visualization to Jenkins and an improved way to navigate logs. At the same time, Blue Ocean is built as an opinionated solution and it lacks the extensibility and reporting features provided by Jenkins. For example, one cannot browse code coverage reports from Blue Ocean while the regular Jenkins UI provides the Code Coverage API Plugin. The same is true for static analysis reports (Warnings NG) and many other features critical for continuous integration use-cases. Due to the lack of extensibility, plugin maintainers and contributors were unable to add similar features to BlueOcean. It left users with a need to frequently switch between two interfaces.
In November 2019, the company that funded Blue Ocean announced that from then on they would be focusing on improving regular Jenkins UI instead of Blue Ocean. That has left a gap for the current Blue Ocean users.
It has the most feature requests or bugs open of any plugin in Jenkins:

Why not just improve Blue Ocean itself?
Unfortunately, Blue Ocean can be quite difficult to develop on, many laptops struggle to run the development version of it. It can take hours to build it from scratch. There are more issues here too but let’s focus on the future and move forward.
Bringing pipeline visualization to Jenkins’s UI
In September 2020 Cliff Meyers started a prototype for moving the Blue Ocean graph into Jenkins’s regular UI.
During the February 2021 Contributor Summit I hacked together a working version of Cliff’s prototype and presented it at the closing session of the summit:
2021 02 25 Jenkins Contributor Summit Closing Session
Since then more features have come along, the main highlights being:
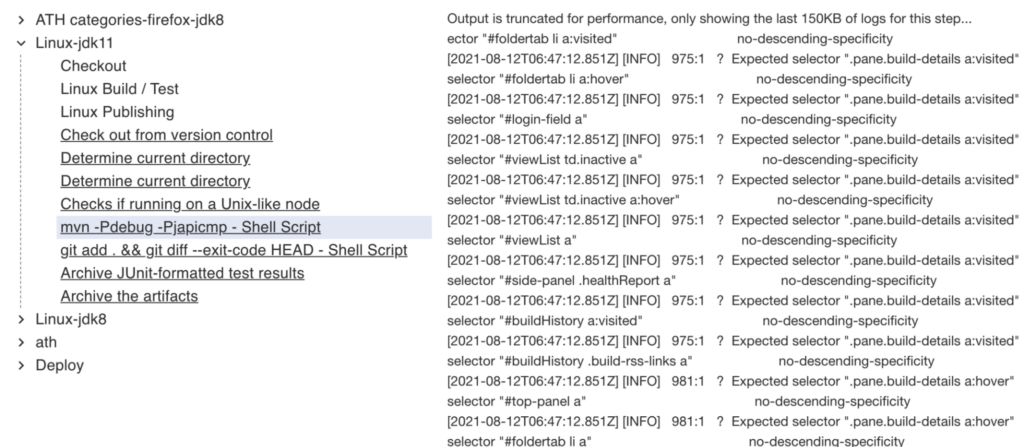
- Pipeline log visualization – Contributed by @timbrown5
- Theme compatibility for logs and graph – Contributed by myself (@timja)
What’s next
This completely depends on contributions received or the time I get to spend on this.
I would like to add more information to the “Pipeline Graph” page with content like:
- Branch name / Pull request title
- Overall build status
- Restarting the build
- Integrate test results / Artifacts / Coverage / Warnings in some way
I don’t want the “Pipeline Graph” page to become like the current Jenkins build page where every plugin just adds information to it and it becomes a mess.
Try it out
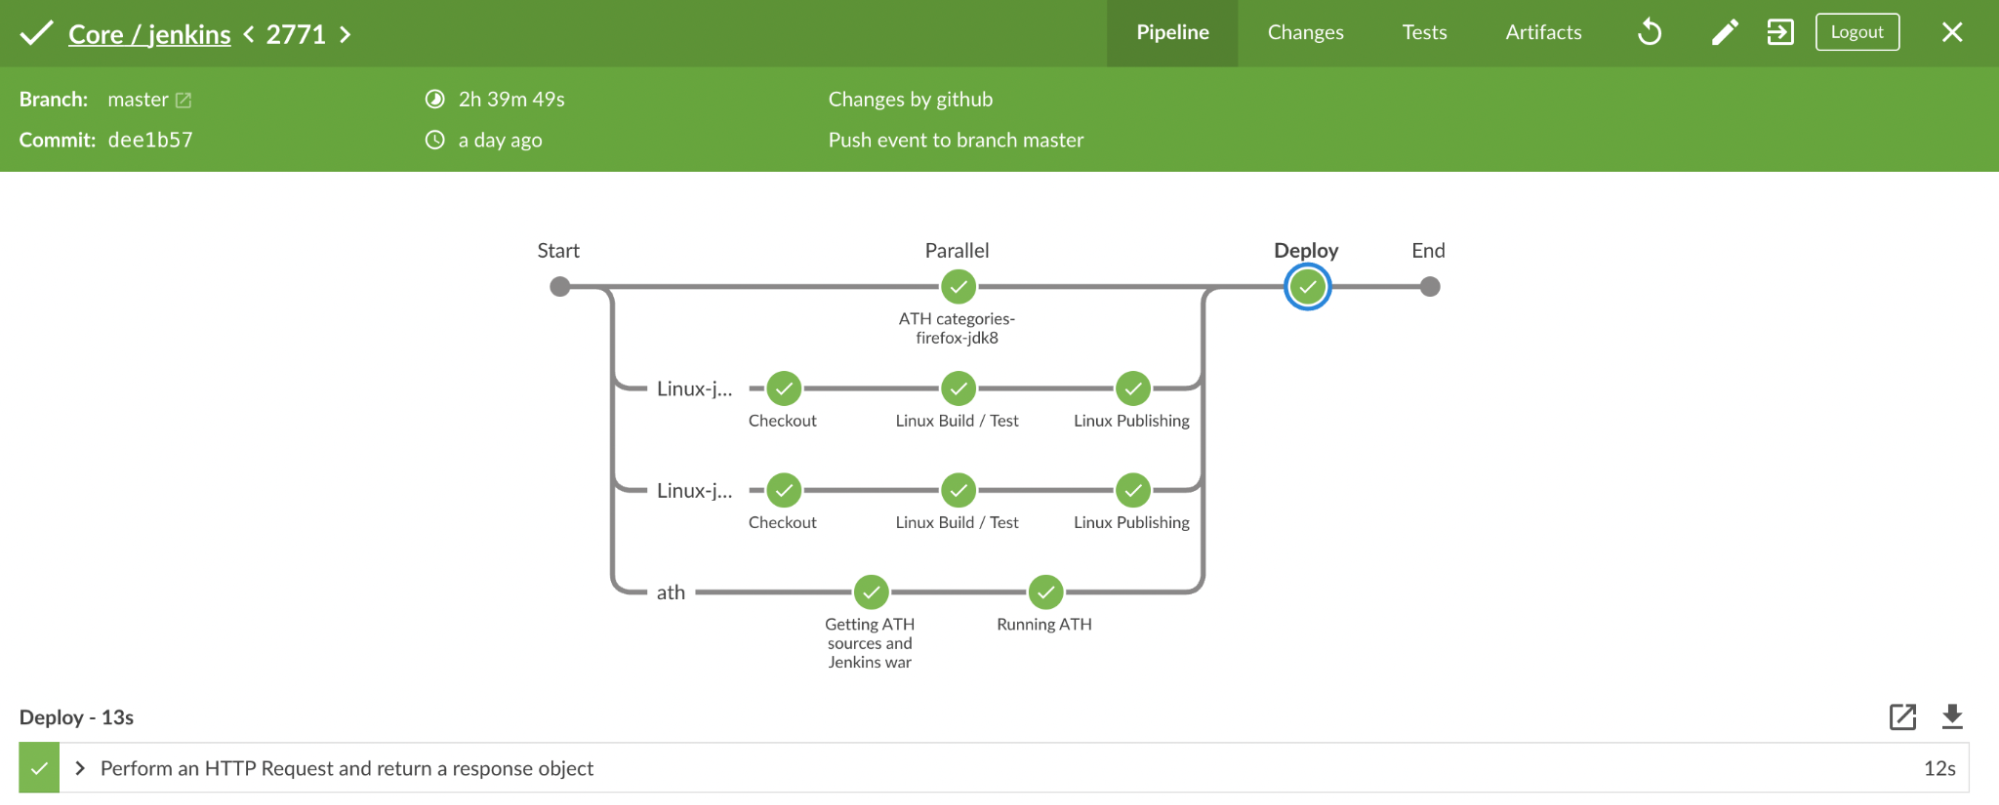
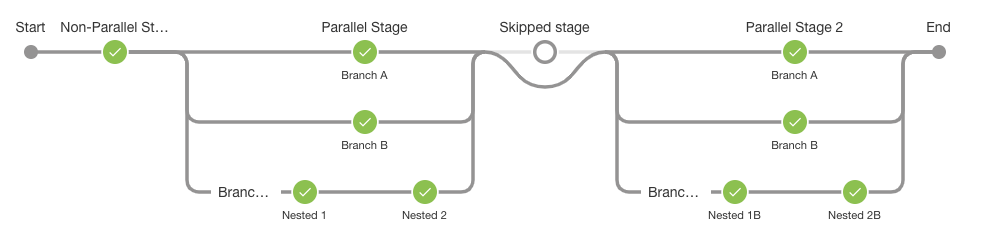
The Pipeline Graph View plugin is installed on the Jenkins project CI server https://ci.jenkins.io, available for anyone to take a look.
A few examples:
It’s available on the Jenkins update center as ‘Pipeline Graph View Plugin’ (id: pipeline-graph-view)
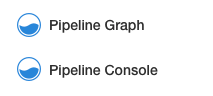
Just install it and you will see links to it appearing in your build results page:
Feedback:
https://community.jenkins.io/t/blue-ocean-but-in-classic-ui/96/15
Feature requests or bugs to: https://github.com/jenkinsci/pipeline-graph-view-plugin/issues
Call for contributors
I have very limited time to spend on this plugin and would love to get more contributors involved or even a company that would like to contribute some engineering time!
The tech stack is:
- React
- Webpack
- Java 8
- Maven
Designers would be especially welcomed, as that’s not my strength at all, how best to help I would leave to you but please reach out via GitHub issues.
If you want to help just comment on an issue saying that you would like to work on it, or create a new issue with the feature you would like to contribute, the contributing document has some tips for getting started (improvements there are always welcomed).