All Posts By

cdfoundation

Tracy Ragan, DeployHub CEO, Re-elected to CD Foundation Board

By Announcement, Blog

Tracy Ragan re-elected to serve a 2nd year on the Continuous Delivery Foundation Governing Board

Santa Fe, NM – April 17, 2020– DeployHub, creators of the first microservice management platform, today announced that the Continuous Delivery Foundation Board (CDF) has re-elected Tracy Ragan as the General Membership Board Representative.

“It has been an honor to serve as the General Member Representative for the CDF over the last year,” said Tracy Ragan. “This is an area that I have devoted my entire career to.  To have the opportunity to work with other member companies who really get this space has been an amazing community experience. I promise to continue working as hard this year as I did last.”

About DeployHub

Moving to microservices breaks the way we assemble and configure software. DeployHub puts it back together by providing a central ‘hub’ for cataloging, versioning, sharing and releasing microservices across the organization. DeployHub empowers your high performing software engineers to easily move from monolithic to microservices.  For more information on DeployHub, go to www.DeployHub.com

About the CD Foundation

The Continuous Delivery Foundation (CDF) serves as the vendor-neutral home of many of the fastest-growing projects for continuous integration/continuous delivery (CI/CD). It fosters vendor-neutral collaboration between the industry’s top developers, end users and vendors to further CI/CD best practices and industry specifications. Its mission is to grow and sustain projects that are part of the broad and growing continuous delivery ecosystem.

DeployHub is a registered trademark of DeployHub, Inc. All other trademarks used in this document are the property of their respective owners.

The URL for this release is located at: : https://www.deployhub.com/tracy-ragan-re-elected-to-the-cdf-governing-board/

New Chair of CD Foundation Outreach Committee Elected

By Announcement, Blog

We are excited to announce that Rosalind Benoit has been elected the CD Foundation Outreach Committee Chairperson.

Rosalind is Director of Community at Armory, where she works to enable and energize the Spinnaker ecosystem. Rosalind holds an MSIS in Database & Internet Technologies from Northwestern University. Her passion for enacting change via software comes from a varied background in system administration, development, project management, and education, along with a lifelong love of Linux. She makes and facilitates Spinnaker contributions that improve the developer experience and share the secrets of the optimized Software Development Life Cycle (SDLC). 

The Outreach Committee is responsible for the overall marketing and outreach for CDF projects, ultimately managing and guiding CDF marketing for the Governing Board. Rosalind’s election to the chairperson role is a recognition of her substantial contributions to the marketing of Spinnaker and CDF community efforts.

Rosalind Benoit said,

“I’m thrilled to be elected as Outreach Committee Chair. We have an amazing opportunity to make CDF projects stand out in the industry. I look forward to working with the rest of the CDF community this year! I’d like to thank Alyssa Tong for her hard work as the CDF Outreach Chair and look forward to this coming year!”

As the Outreach chairperson, Rosalind will continue to be a strong voice representing the perspectives of the broader CDF community, especially to the governing board. The CDF is excited to see her continue to help make CDF the definitive destination for the continuous delivery ecosystem.

For more information on CDF’s leadership, please see here, or reach out to us.

How the CDF is Establishing a Shared Vocabulary for the Industry

By Blog, Staff

By Fatih Degirmenci

Continuous Delivery Foundation (CDF) Technical Oversight Committee (TOC) approved the formation of Special Interest Group (SIG) Interoperability January 14, 2020. SIG Interoperability aims to increase integration and interoperability across different tools and technologies in the open source CI/CD ecosystem. One of the prerequisites to achieve this is to provide a neutral forum, enabling dialog between projects and end-users so they can come together and discuss their use cases, needs, and challenges. This will allow projects and communities to explore additional collaboration opportunities and increase the visibility of ongoing work.

One of the means the SIG adapted to provide a forum for discussion is to invite representatives of project and end-user communities to regular SIG meetings so they can present what they are doing. The presentations are then followed by open discussions which allows community members to ask questions, raise concerns, and more importantly start talking with each other. However, one of the things the community noticed is the lack of shared terminology and vocabulary as the tools and technologies employ different terms to describe what is often the same thing.

This is actually not a surprising finding since there are many ways to greet someone and as humans if we do not understand the word being used we have the ability to observe body language, process tone, and even touch. These many different natural inputs allow us as humans to establish shared vocabulary upon which we have been able to build successful components relevant to our way of living and social norms of interacting.

Unfortunately for machines, this process is not so easy as we humans have to decide if we want to establish norms which we often surface when talking about machine interactions as protocols and best practices or requirements.

Continuous Integration (CI) and Continuous Delivery (CD) practitioners have many tools at their disposal but it is often the case that what we call a pipeline in today’s tool of choice is not called the same thing in the tool we use tomorrow. Again, we can within our sphere of influence and interaction adjust for these nuances but machines talking to one another do not have that same luxury necessarily.

These are the thoughts that made contributors to SIG to work on vocabulary and terminology as the first thing right after the SIG was approved to be formed because we believe that if we can establish a shared vocabulary across the industry in CI/CD domain, we can remove the barriers between humans so we can start tackling with getting machines to talk to each other. The way this work is envisioned to be done is to collect the existing terms used by CI/CD tools and technologies in a document, and create a mapping of the terms across projects, essentially making the Rosetta Stone for CI/CD domain. We think that we can continue on this work and look for possibilities to come up with shared vocabulary in a collaborative manner.

The document SIG is working on is available in SIG Interoperability repository on GitHub and it currently contains terms for 10 CI/CD projects as shown on the table below.

Project
CircleCIN/AStepJobWorkflowTriggerExecutor
GitHub ActionsActionStepJobWorkflowEventRunner
GitLab CI/CDN/AJobStagePipelineTriggerRunner
JenkinsN/AJobStagePipelineTriggerAgent/Node
Jenkins XN/AStepStagePipelineTriggerAgent
KeptnN/AN/ATaskWorkflowEventKeptn-Service
ScrewdriverN/AStepJobPipelineTriggerN/A
SpinnakerN/ATaskStagePipelineTriggerCluster
TektonN/AStepTaskPipelineTriggerResource
ZuulN/AN/AJobPipelineTriggerNode

Due to the fact that when organizations establish CI/CD pipelines, they employ not just CI/CD tools but also Software Configuration Management (SCM) systems, Artifact Repository Managers (ARM) and so on. That’s why we included terminology for SCM tools such as Gerrit, GitHub, and GitLab and we expect to have terms used by other tools in adjacent areas collected as well.

It is important to highlight that we consider this work as still ongoing and we encourage and welcome everyone to add terminology used by the project they use and/or are involved in to the document so we have broader coverage of the tools and technologies. If you also notice that there are things that can be improved, feel free to send a pull request to CDF SIG Interoperability repository and improve the existing documentation.

Jenkins X and Kubernetes-native OSS Integration and Extension

By Blog, Project

CDF Newsletter – May 2020 Article
Subscribe to the Newsletter

By Kara de la Marck

Jenkins X is an automated CI/CD platform built on Kubernetes. Jenkins X enables users to harness the power of Kubernetes without needing to be Kubernetes experts. How does a CI/CD platform do this? Jenkins X forms an abstraction layer over Kubernetes, simplifying the developer experience of building, deploying, and running Kubernetes applications. Under the hood, Jenkins X combines best-of-breed open source tools, creating a Kubernetes-native CI/CD platform that facilitates developer and GitOps best practices. 

In this post, we’ll look at how Jenkins X uses Kubernetes Custom Resource Definitions (CRDs) and the Kubernetes API to bring together these best-of-breed open source projects, creating a cutting edge continuous delivery platform on Kubernetes. We’ll highlight two Kubernetes design principles that help us understand how Jenkins X natively extends Kubernetes:

  • Kubernetes API is declarative
  • Kubernetes has no hidden APIs

Kubernetes itself is decomposed into multiple components which interact through the Kubernetes API. Kubernetes’ declarative, API driven infrastructure enables it to be composable and extensible.

Kubernetes API is declarative

The Kubernetes API is declarative rather than imperative: as a user, you declare the desired state of your application and the Kubernetes system drives to make it so. One important benefit of this is automatic recovery. If something happens to your application, for example, a node crashes, then Kubernetes will restore the desired state.

Kubernetes has no hidden APIs

The Kubernetes API is exposed by the Kubernetes API server, which is a component of the Kubernetes control plane. The Kubernetes control plane is transparent in that there are no hidden internal APIs in Kubernetes: Kubernetes components interact through the same API that Kubernetes exposes to its users.

A declarative, API driven infrastructure

Kubernetes’ declarative, API driven infrastructure means that components, such as nodes, talk to the Kubernetes API server to figure out what their state ought to be. Instead of having the decision centralised and sent out, each node is responsible for its own health, and figuring out its desired behaviour. If a node fails and is brought back up, the newly created node can query the API server to figure out what it’s supposed to do.

The declarative way the Kubernetes API server communicates with remote nodes is in contrast to traditional client – server relationships, where the client tells the server what to do in an imperative manner and the server does it. Building the Kubernetes API server this way would have meant it grew as more functionality was added; the API server would have been brittle and difficult to extend.

Kubernetes is using a pattern called level triggered, which is generally opposed to edge triggered. In edge triggered systems the system responds to events, but if the system doesn’t receive an event, then the event needs to be replayed for the system to recover.

“If you are edge triggered you run risk of compromising your state and never being able to re-create the state. If you are level triggered the pattern is very forgiving, and allows room for components not behaving as they should to be rectified. This is what makes Kubernetes work so well.”

Joe Beda, as quoted in Cloud Native Infrastructure, by Justin Garrison and Kris Nova 

In Kubernetes, if any component goes down, when it comes back up, it requests the desired state from the Kubernetes API server and works to match that state. Components that can recover in this way tend to be more robust and the overall system is more reliable. This is especially true in distributed systems, where there are so many components in the system that the expectation is that there will always be components failing. Distributed systems need to be designed to tolerate the failure of components. If your system has one central manager component, which tells all the parts of the system what they should be doing, and that central manager component goes down, your system is down. Distributing that responsibility, so every component can figure out what it should be doing, makes the system more reliable. No longer is there a single point of failure. 

What happens when the Kubernetes API server, which acts as a central point, goes down? All the components will continue to operate on the last information they received. When the API server comes back up, the components will then operate on the new state if there were any changes. If any of the components go down, the other components can continue to function independently of that failure. When failed components come back up, they can read the state they should work towards from the API server.

These design choices make Kubernetes reliable. They also make Kubernetes very composable and extensible. Because all components use the same Kubernetes API as you do as an end user, you can replace any default component with your own. You can also add new components to enable new functionality. This extensibility has helped create a vibrant ecosystem of Kubernetes-native open source projects that like Jenkins X are built on Kubernetes using Kubernetes resources and the Kubernetes API machinery.

Custom Resource Definitions (CRDs)

Kubernetes is extended through Custom Resource Definitions (CRDs). A Kubernetes resource is an endpoint in the Kubernetes API that stores API objects of a certain type. Kubernetes uses API objects to represent the state of your cluster. 

To create your own custom Kubernetes API object type, define a new CRD of your type and define the schema. Then you can create your own objects against the Kubernetes API server. In this way, a custom resource extends the Kubernetes API: creating CRDs is like embedding your own APIs inside Kubernetes itself. To use the custom API objects you have created, you write your own custom controllers that act on the data contained in your custom object types. Kubernetes controllers are the mechanism by which Kubernetes reconciles the state state of your cluster to the state declared in the Kubernetes API.

How do CRDs relate to Kubernetes built-in types? Tim Hockin, co-founder of the Kubernetes project, has said, “If we had CRDs on day zero of Kubernetes there would be no built-in types.” If CRDs had existed from the start, pods and nodes and everything else would also be a CRD! 

If they weren’t part of the original design, why were CRDs created? CRDs were first created as a way to extend Kubernetes functionality to enable rapid prototyping. 

“That’s what fascinates me about CRD. It started as a prototyping tool. K8s API machinery was not intended to be a framework, but that is what shook out. If we did that intentionally we would have messed it up.”

– Tim Hockin, Twitter

It’s extremely interesting that CRDs, which started as a prototyping mechanism, are now the main resource definition mechanism in Kubernetes. This enables Kubernetes to be more modular, and many core Kubernetes functions are now built using custom resources. 

The Kubernetes API machinery is now distilled such that it can be used as API machinery for any project, not just Kubernetes. The extensible nature of the Kubernetes API enables higher level applications and platforms to be built on Kubernetes. Jenkins X  runs directly on Kubernetes, uses the Kubernetes API, and defines CRDs for its workflow. Moreover, the same Kubernetes API machinery that makes Kubernetes extensible also enables Kubernetes-native applications to integrate well with each other. Jenkins X both creates its own CRDs and integrates with other Kubernetes-native applications through the Kubernetes API to form a Kubernetes-native CI/CD platform.

Jenkins X High Level Architecture:

As seen in the diagram above, Jenkins X integrates with a number of open source projects such as TektonProw, and Vault, among others, to create an automated Kubernetes-native CI/CD platform. Jenkins X relies on CRDs to create new resources and extend the Kubernetes API. The Kubernetes API machinery enables Jenkins X to integrate with other open source projects through the Kubernetes API server.

Tekton, the pipeline execution engine for Jenkins X

Tekton is the pipeline execution engine for Jenkins X. Like Jenkins X, Tekton is Kubernetes-native and extends Kubernetes using CRDs. Jenkins X leverages Prow, or Jenkins X’s own Lighthouse, to signal to Tekton to run builds. Lighthouse is a lightweight webhook handler, which listens for Git webhook events and uses them to trigger Tekton PipelineRun CRDs for Tekton to use to perform builds. Tekton then generates a status update which Jenkins X communicates back to source code management providers, such as GitHub. 

The integration between Jenkins X as a CI/CD platform and Tekton as the execution engine for Jenkins X happens within Kubernetes using CRDs and the Kubernetes API. That both projects are Kubernetes-native enables them to seamlessly integrate using the Kubernetes API machinery.

“Tekton Pipelines lets us power Jenkins X’s execution and management of pipelines natively within Kubernetes.”

 – Andrew Bayer, Software Engineer, CloudBees, and creator of Jenkins X Pipeline Syntax

Tekton Pipelines for CD Interoperability

By Blog, Project

CDF Newsletter – May 2020 Article
Subscribe to the Newsletter

Contributed By Eric Sorenson

Tekton is a project that evolved from an internal Google tool that used Knative to build and deploy software. In 2018, it was spun out as an independent project and donated to the Continuous Delivery Foundation.

The core component, Tekton Pipelines, runs as a controller in a Kubernetes cluster. It registers several custom resource definitions which represent the basic Tekton objects with the Kubernetes API server, so the cluster knows to delegate requests containing those objects to Tekton. These primitives are fundamental to the way Tekton works. Tekton’s building block approach starts with the smallest atom of work, the Step, aggregates Steps together in Tasks, and aggregates Tasks together in Pipelines. 

If the nomenclature here feels confusing, don’t feel bad — it is complicated! Each tool in the space uses slightly different terms; this is something we’re working on standardizing in the CDF Interoperability SIG. We’d love your input – here’s how to participate! Tekton’s usage of these terms is clarified in the sig-interop Vocabulary definitions doc:

* *Step*: a specific function to perform.

* *Task*: is a collection of sequential steps you would want to run as part of your continuous integration flow. A task will run inside a pod on your cluster.

* *ClusterTask*: Similar to Task, but with a cluster scope.

* *Pipeline*: stateless, reusable, parameterized collection of tasks. Tasks are linked together in a Pipeline, which describes the end-to-end deployment for an application.

* *PipelineRun*: an instantiation of a Pipeline definition, filling in the Pipeline’s parameters with concrete values

* *Pipeline Resource*: objects that will be input to or output from tasks

* *Trigger*: Triggers is a Kubernetes Custom Resource Definition (CRD) controller that allows you to extract information from event payloads (a “trigger”) to create Kubernetes resources.

Notable omissions from the CRD list are “Steps”, which don’t have their own CRD because they’re the smallest unit of execution which are always contained inside a Task. The Conditions and Dashboard Extension CRDs are still optional and experimental — but very exciting!

Tekton’s approach is particularly interesting from a tool interoperability standpoint. By focusing on these building blocks and the concrete representation of them as declarative configuration, Tekton creates a standard platform for CD in the same way that Kubernetes provides a platform for application runtimes. This allows user-facing tools to build on the platform rather than reinventing these primitives. Several projects have already taken up this approach:

* Jenkins X uses Tekton as its execution engine. It’s been an option for a while now, but recently the project announced it was moving to using Tekton exclusively. Jenkins X provides pipeline definitions and gitops workflows that are tailored for cloud-native CD.

* Kabanero is a project that enables teams to develop and deploy applications on Kubernetes, so architects can provide pre-approved application stacks for developers to work from. It uses Tekton Pipelines and several associated projects like Tekton Dashboard and Triggers; indeed the developers building the Dashboard are largely working on Kabanero and the IBM Cloud Devops Pipeline product.

* Relay by Puppet is a hosted service that uses Tekton as the execution engine for event-triggered devops and deployment workflows. (Full disclosure, this is the product I am working on!) It provides a YAML dialect for building workflows that can be triggered by external events, via API, or manually, to automate tasks that need to stitch together different tools and services.

* TriggerMesh have integrated Tekton Pipelines into their TriggerMesh Cloud project and are working on a tool called Aktion to translate Github Actions into Tekton Pipelines.

* There are more, too! Check out the Tekton Friends repo for a longer list of projects and end users building on Tekton.

As exciting as this activity is, I think it’s important to note there’s still a lot of work to be done. There’s a distinct difference between two projects both using Tekton as a common upstream platform and achieving interoperability between them! It’s a big problem and it’s easy to get overwhelmed with the magnitude of the whole thing. One of my earliest lessons when I moved from SRE into product management was: focus first on solving the pain points which end users feel most acutely. That can be some combination of pervasiveness (what percent of the overall user base feels it?) and severity (how bad is each individual incident?) – ideally, fix the thing which is worst on both axes! From an end user’s standpoint, CD tools have a pretty steep learning curve with a bunch of pitfalls. A sampling of these severe-and-pervasive pitfalls I’ve heard from our users as we’ve been building Relay:

* How do I wrap my head around the terminology and technology so I can get started?

* How do I integrate the parts of the build/test/deploy toolchain my organization needs to continue using?

* How do I operate (upgrade, monitor, troubleshoot) the tool once it’s up and running?

Interoperability isn’t a cure-all, but there are definitely areas where it could work like a soothing balm on all of this pain. Industry-standard terminology or at a minimum, an authoritative Rosetta Stone for CD, could help. At the moment, there’s still pockets of debate on whether the “D” stands for Deployment or Delivery! (It’s “Delivery”, folks – when you mean “Deployment” you have to spell it out.)

Going deeper, it’d be hugely helpful help users integrate the tools they’re already using into a new framework. A wide ecosystem of steps that could be used by any of the containerized CD tools – not just those based on Tekton but, for example, Spinnaker and Keptn as well – would have a number of benefits. For end users, it would increase the amount of content available “out of the box”, meaning they would have less work to integrate the tools and services they need. Ideally, no end-user should have to create a step from scratch because there’s a vast, easily discoverable library of things that accomplish the job they have. There’s also a benefit to maintainers of services and tools that end-users want, like Kaniko, Gradle, and the cloud services, who have to build an integration with each execution framework themselves or rely on the community to do it. Building and maintaining one reusable implementation would reduce the maintenance burden and allow them to provide higher quality. 

To put on my Tekton advocate hat for a moment, its well-defined container contract makes it easy to use general-purpose containers in your pipeline. If you want to take advantage of more specialized features the framework provides, the Tekton Catalog has a number of high-quality examples to build from. There are improvements on the way to aid the discoverability and reuse parts of the problem, such as the exciting new Tekton Hub donated by Red Hat. 

The operability concerns are a real problem for CD pipeline tools, too. Although CD is usually associated with development, in many organizations the tool itself is considered a production service, because if there are problems committing, building, testing, and shipping code, the engineering organization isn’t delivering value. Troubleshooting byzantine failures in complex CI/CD pipelines is a specialized discipline requiring skills that span Quality Engineering, SRE, and Development. The more resilient the CD tools are architected, and the more standard their interfaces for reporting availability and performance metrics, the easier that troubleshooting becomes. 

Again, to address these from Tekton’s perspective, a huge benefit of running on Kubernetes is that the Tekton services that run in the cluster can take advantage of all the powerful k8s operability features. So fundamental capabilities that are highly valuable to operators and troubleshooters like log aggregation, in-place upgrades, error reporting, and scale-out all ride on top of the Kubernetes infrastructure. It’s not “for free” of course; nothing in distributed systems is ever truly “for free” and if anyone tries to tell you otherwise, the thing they’re selling you is probably *very* expensive. But it does mean that general-purpose Kubernetes skills and tooling goes a long way towards operating Tekton at scale, rather than having to relearn or reimplement them at the application layer.

In conclusion, I’m excited that the interoperability conversation is well underway at the CDF. There’s a long way to go, but the amount of activity and progress in the space is very encouraging. If you’re interested in pitching in to discuss and solve these kinds of problems, please feel free to join in #sig-interoperability channel on the CDF slack or check out the contribution information

Introducing our newest CDF Ambassador – Yun “Forest” Jing (景韵)

By Blog, Staff

Hi CI/CD fans,

I’m Yun “Forest” Jing (景韵), a DevOps practitioner from China. I believe IT changes the world, and that DevOps changes IT.

You can read the blog First Online CI/CD Meetup in China Gets Over 5,000 Attendees. It is very inspiring to share knowledge and experiences in the community, so I’ve co-founded a local community called DevOps Times Community where there are almost 30,000 subscribers in our wechat official account. 

I’m also a Jenkins Ambassador and DevOps Institute Ambassador, too. I’ve organized the Jenkins Area Meetup and Jenkins User Conference China for 3 years. It was an honorable moment to win the Most Valuable Advocate of Jenkins community and to be Jenkins Ambassador in 2018, as well.

I, Xuefeng “BC” Shi and Tao Lei were on DevOps World 2018 San Francisco

Jenkins Ambassador Teams

My story with DevOps started from an email sent by my boss in 2014. He said, “make a study of DevOps.” And so it began. 

I found an internal community in our company where architects, developers, testers, and ops could meet together to understand and learn from each other.

Logo and Slogan of Internal DevOps Community

And I didn’t forget the work assigned by my boss . I’ve led from start to release an internal DevOps Guide to help all teams to practice DevOps.

The architecture of DevOps Guide in Chinese

2017 will be a memorable year for me. DevOpsDays Beijing 2017 has lit up DevOps in China. Lots of companies shared their experience about DevOps, such as Alibaba, Tencent, Baidu, Huawei, etc.

Patrick Debois and Me (Master and Newbie)

From 2017, I also started to be a full-time member of the community. I’ve co-organized the local DevOps event coined the DevOps International Summit (DOIS) and Jenkins User Conference in Beijing, Shanghai and Shenzhen to share Agile, CI/CD, AIOps, DevOps practices and experiences in China.

I’ve joined the experts group to contribute to the DevOps Capability Maturity Model organized by CAICT, as well. Lots of companies could learn how to practice according to this model.

Not only focused on China, but also built the communication bridge with the global DevOps community and companies. For this, Kohsuke Kawaguchi and Alyssa Tong have really helped a lot.

 JUCC Shanghai 2017

Alan Shimel and Jayne Groll  have also inspired me to introduce more experiences from China to the world and also from the world to China. So, I’m a DevOps Institute Ambassador right now. It is a great team helping to share DevOps with the world.

From Jenkins – GitHub App authentication support released

By Blog, Project

Originally posted on the Jenkins blog by Tim Jacomb

I’m excited to announce support for authenticating as a GitHub app in Jenkins. This has been a long awaited feature by many users.

It has been released in GitHub Branch Source 2.7.0-beta1 which is available in the Jenkins experimental update center.

Authenticating as a GitHub app brings many benefits:

  • Larger rate limits – The rate limit for a GitHub app scales with your organization size, whereas a user based token has a limit of 5000 regardless of how many repositories you have.
  • User-independent authentication – Each GitHub app has its own user-independent authentication. No more need for ‘bot’ users or figuring out who should be the owner of 2FA or OAuth tokens.
  • Improved security and tighter permissions – GitHub Apps offer much finer-grained permissions compared to a service user and its personal access tokens. This lets the Jenkins GitHub app require a much smaller set of privileges to run properly.
  • Access to GitHub Checks API – GitHub Apps can access the the GitHub Checks API to create check runs and check suites from Jenkins jobs and provide detailed feedback on commits as well as code annotation

Getting started

Install the GitHub Branch Source plugin, make sure the version is at least 2.7.0-beta1. Installation guidelines for beta releases are available here

Configuring the GitHub Organization Folder

Follow the GitHub App Authentication setup guide. These instructions are also linked from the plugin’s README on GitHub.

Once you’ve finished setting it up, Jenkins will validate your credential and you should see your new rate limit. Here’s an example on a large org:

GitHub app rate limit

How do I get an API token in my pipeline?

In addition to usage of GitHub App authentication for Multi-Branch Pipeline, you can also use app authentication directly in your Pipelines. You can access the Bearer token for the GitHub API by just loading a ‘Username/Password’ credential as usual, the plugin will handle authenticating with GitHub in the background.

This could be used to call additional GitHub API endpoints from your pipeline, possibly the deployments api or you may wish to implement your own checks api integration until Jenkins supports this out of the box.

Note: the API token you get will only be valid for one hour, don’t get it at the start of the pipeline and assume it will be valid all the way through

Example: Let’s submit a check run to Jenkins from our Pipeline:

pipeline {
  agent any

  stages{
    stage('Check run') {
      steps {
        withCredentials([usernamePassword(credentialsId: 'githubapp-jenkins',
                                          usernameVariable: 'GITHUB_APP',
                                          passwordVariable: 'GITHUB_JWT_TOKEN')]) {
            sh '''
            curl -H "Content-Type: application/json" \
                 -H "Accept: application/vnd.github.antiope-preview+json" \
                 -H "authorization: Bearer ${GITHUB_JWT_TOKEN}" \
                 -d '{ "name": "check_run", \
                       "head_sha": "'${GIT_COMMIT}'", \
                       "status": "in_progress", \
                       "external_id": "42", \
                       "started_at": "2020-03-05T11:14:52Z", \
                       "output": { "title": "Check run from Jenkins!", \
                                   "summary": "This is a check run which has been generated from Jenkins as GitHub App", \
                                   "text": "...and that is awesome"}}' https://api.github.com/repos/<org>/<repo>/check-runs
            '''
        }
      }
    }
  }
}

What’s next

GitHub Apps authentication in Jenkins is a huge improvement. Many teams have already started using it and have helped improve it by giving pre-release feedback. There are more improvements on the way.

There’s a proposed Google Summer of Code project: GitHub Checks API for Jenkins Plugins. It will look at integrating with the Checks API, with a focus on reporting issues found using the warnings-ng plugin directly onto the GitHub pull requests, along with test results summary on GitHub. Hopefully it will make the Pipeline example below much simpler for Jenkins users 🙂 If you want to get involved with this, join the GSoC Gitter channel and ask how you can help.

Insights by Harness – Common Challenges with Continuous Delivery

By Blog, Member

At Harness, we are here to champion Continuous Delivery for all. As a member of the Continuous Delivery Foundation [CDF], we’re happy to see that the industry has taken a collective step forward to better each other’s capabilities. We are pretty fortunate to have the opportunity to talk to many people along their Continuous Delivery journey. Part of what we do at Harness when engaging with a customer or prospect is help run a Continuous Delivery Capability Assessment (CDCA) to catalog and measure maturity. 

Over the past year, we have analyzed and aggregated the capability assessments that we have performed. We uncovered common challenges organizations faced in the past 12 months. In Continuous Delivery Insights 2020, we identified the time, effort, cost, and velocity associated with their current Continuous Delivery process. Trending data that we have around key metrics is that velocity is up but also complexity and cost are on the rise. 

Key Findings

We observed the following Continuous Delivery performance metrics across the sample of over 100 firms. Organizations that are looking towards strengthening or furthering their Continuous Delivery goals we noticed the following with median [middle] or average values. As sophisticated as organizations are, there is still a lot of effort to get features/fixes into production. 

In terms of deployment frequency, we define deployment frequency as the number of times a build is deployed to production. In terms of a microservices architecture, deployment frequency is usually increased as the number of services typically have a one to one relationship with the build. For the sample set we interviewed, the median deployment frequency is ten days which shows bi-monthly deployments are becoming more the norm.

These bi-monthly deployments might be on demand but the lead times can start to add up. Lead time is the amount of time needed to validate a deployment once the process has started. Through the sample, organizations typically require an average of eight hours; e.g eight hours of advance notice to allow validation and sign off of a deployment. 

If during those eight hours of lead time during the validation steps, if a decision is made to roll back, we saw that organizations in the sample averaged 60 mins of time to restore a service e.g roll back or roll forward. An hour might not seem too long to some but for engineers, every second can feel stressful as you race to restore your SLAs

Adding up all the effort from different team members during a deployment, getting an artifact into production represented an average of 25 human hours of work. Certainly, different team members will have varying levels of involvement throughout the build, deploy, and validation cycles but represents more than ½ a week of a full-time employee in total burden. 

Software development is full of unknowns; core to innovation we are trying and developing approaches and features for the first time. Expectation is there for iteration and learning from failures. We certainly have gotten better at deployment and testing methodologies and one way to measure is with change failure rate or the percentage of deployments that fail. Through the sample set, there was on average 11% of deployments failed. Not all doom and gloom, the Continuous Delivery Foundation is here to move the needle forward. 

Looking Forward 

The goal of the Continuous Delivery Foundation and Harness is to collectively raise the bar around software delivery. For organizations that are members of the Continuous Delivery Foundation, deploying via a canary deployment seems like second nature for safer deployments. If you are unfamiliar with a canary deployment, basically a safe approach to releasing where you send in a canary [release candidate] and incrementally replace the stable version until the canary has taken over.  As simple as this concept is to grasp, in practice can be difficult. In Continuous Delivery Insights 2020, only about four percent of organizations were taking a canary based approach somewhere in their organization. 
We are excited to start to track metrics on the overall challenges with Continuous Delivery year to year and work towards improving the metrics and adoption of Continous Delivery approaches for all. For greater insights, approaches, and breakdowns, feel free to grab your digital copy of Continuous Delivery Insights 2020 today!

Tekton: Wow! We’re beta now!

By Blog, Project

You may have heard that Tekton Pipelines is now beta! That’s not beta like the video format but beta like Kubernetes! Okay I’ll stop trying to make jokes, because compatibility is no laughing matter for folks who want to build on top of and use Tekton, and that’s why we’ve declared beta, so that you can feel more confident in using it.

What exactly does beta mean for Tekton?

So what does beta mean exactly? It means for Tekton what it means for Kubernetes, and it boils down to two things:

  1. Features that are beta will not be removed; they might change but you can count on the features themselves sticking around
  2. Backwards incompatible changes to the API will be avoided; if they do have to happen you will be given at least 9 months worth of releases to migrate to the new way of doing things

You might be wondering what “the API” means in this context – good question! It’s the specifications of the CRDs themselves and runtime details like the special directories that Tekton makes.

Not all of Tekton is beta however! Right now it’s just Tekton Pipelines and it’s only the following CRDs:

  • Tasks, ClusterTasks and TaskRuns
  • Pipelines and PipelineRuns


This means that other types that you might like, such as Conditions and PipelineResources (see the next section!) are still alpha and don’t (yet!) have the same beta level guarantees.

You can always refer to our API compatibility docs in our repo if you forget!

What about PipelineResources?

What about them indeed! If you are part of the Tekton community, you’ll know that we keep going back and forth on our love/hate-able PipelineResources – the feature you love until it doesn’t work.

A few months ago, our “difficult to understand, hard to debug” friend was challenged by the community: what would the Tekton world look like without PipelineResources? And when we went on that journey, we discovered features which PipelineResources gave us which were super useful on their own:

So we focused on adding those features and brought them to beta. In the meantime, we keep asking the question: do we still need PipelineResources? And what would they look like if redesigned with workspaces and results? We’re still asking those questions and that’s why PipelineResources aren’t beta (yet)!

We know some users really love them: “There are dozens of us,” – @dlorenc. So we haven’t given up on them yet, and there are some things that you just still can’t do well without them: for example, how do you consistently represent artifacts such as images moving through Pipelines? You can’t! So the investigation continues.

In the meantime, we’ve made Task equivalents of some of our PipelineResources in the Tekton catalog, such as PullRequests, GCS, and git.

Tekton Website is Live Now!

Hooray! Our shiny new site is live! Right this way -> https://tekton.dev/

Tekton Documentation is now hosted on the website at https://tekton.dev/docs/. And interactive tutorials are hosted at https://tekton.dev/try/. There is just one interactive tutorial hosted right now but more are in process to get published, so watch this space!

What’s coming up next?

We’re hard at work on more nifty Tekton stuff to make your CI/CD Pipelines more powerful and more portable by achieving Tekton’s mission:

Be the industry-standard, cloud-native CI/CD platform components and ecosystem.

Check out more on our mission and our 2020 roadmap in our community repo.

THANK YOU!!! ❤️

Thanks to all of the many amazing contributors who have gotten us to this point! The list below is people credited in Tekton Pipelines release notes, but for the complete list of everyone contributing to Tekton check out our devstats!

From Jenkins – Validating JCasC configuration files using Visual Studio Code

By Blog, Project

Originally posted on the Jenkins Blog by Sladyn Nunes

Configuration-as-code plugin

Problem Statement: Convert the existing schema validation workflow from the current scripting language in the Jenkins Configuration as Code Plugin to a Java based rewrite thereby enhancing its readablity and testability supported by a testing framework for the same. Enhance developer experience by developing a VSCode Plugin to facilitate autocompletion and validation which would help the developer write correct yaml files before application to a Jenkins Instance.

The Configuration as Code plugin has been designed as an opinionated way to configure Jenkins based on human-readable declarative configuration files. Writing such a file should be feasible without being a Jenkins expert, just translating into code a configuration process one is used to executing in the web UI. The plugin uses a schema to verify the files being applied to the Jenkins instance.

With the new JSON Schema being enabled developers can now test their yaml file against it. The schema checks the descriptors i.e. configuration that can be applied to a plugin or Jenkins core, the correct type is used and help text is provided in some cases. VSCode allows us to test out the schema right out of the box with some modifications. This project was built as part of the Community Bridge initiative which is a platform created by the Linux Foundation to empower developers — and the individuals and companies who support them — to advance sustainability, security, and diversity in open source technology. You can take a look at the Jenkins Community Bridge Project Page

Steps to Enable the Schema Validation

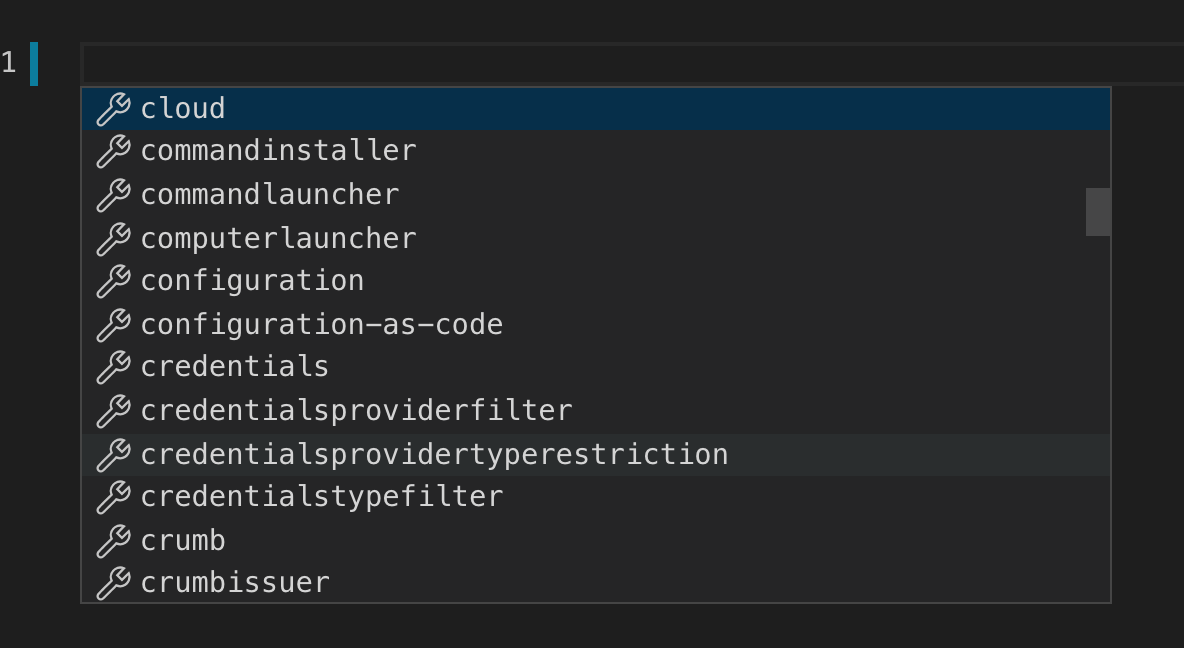
a) The first step includes installing the JCasC Plugin for Visual Studio Code and opening up the extension via the extension list. Shortcut for opening the extension list in VSCode editor using Ctrl + Shift + X.

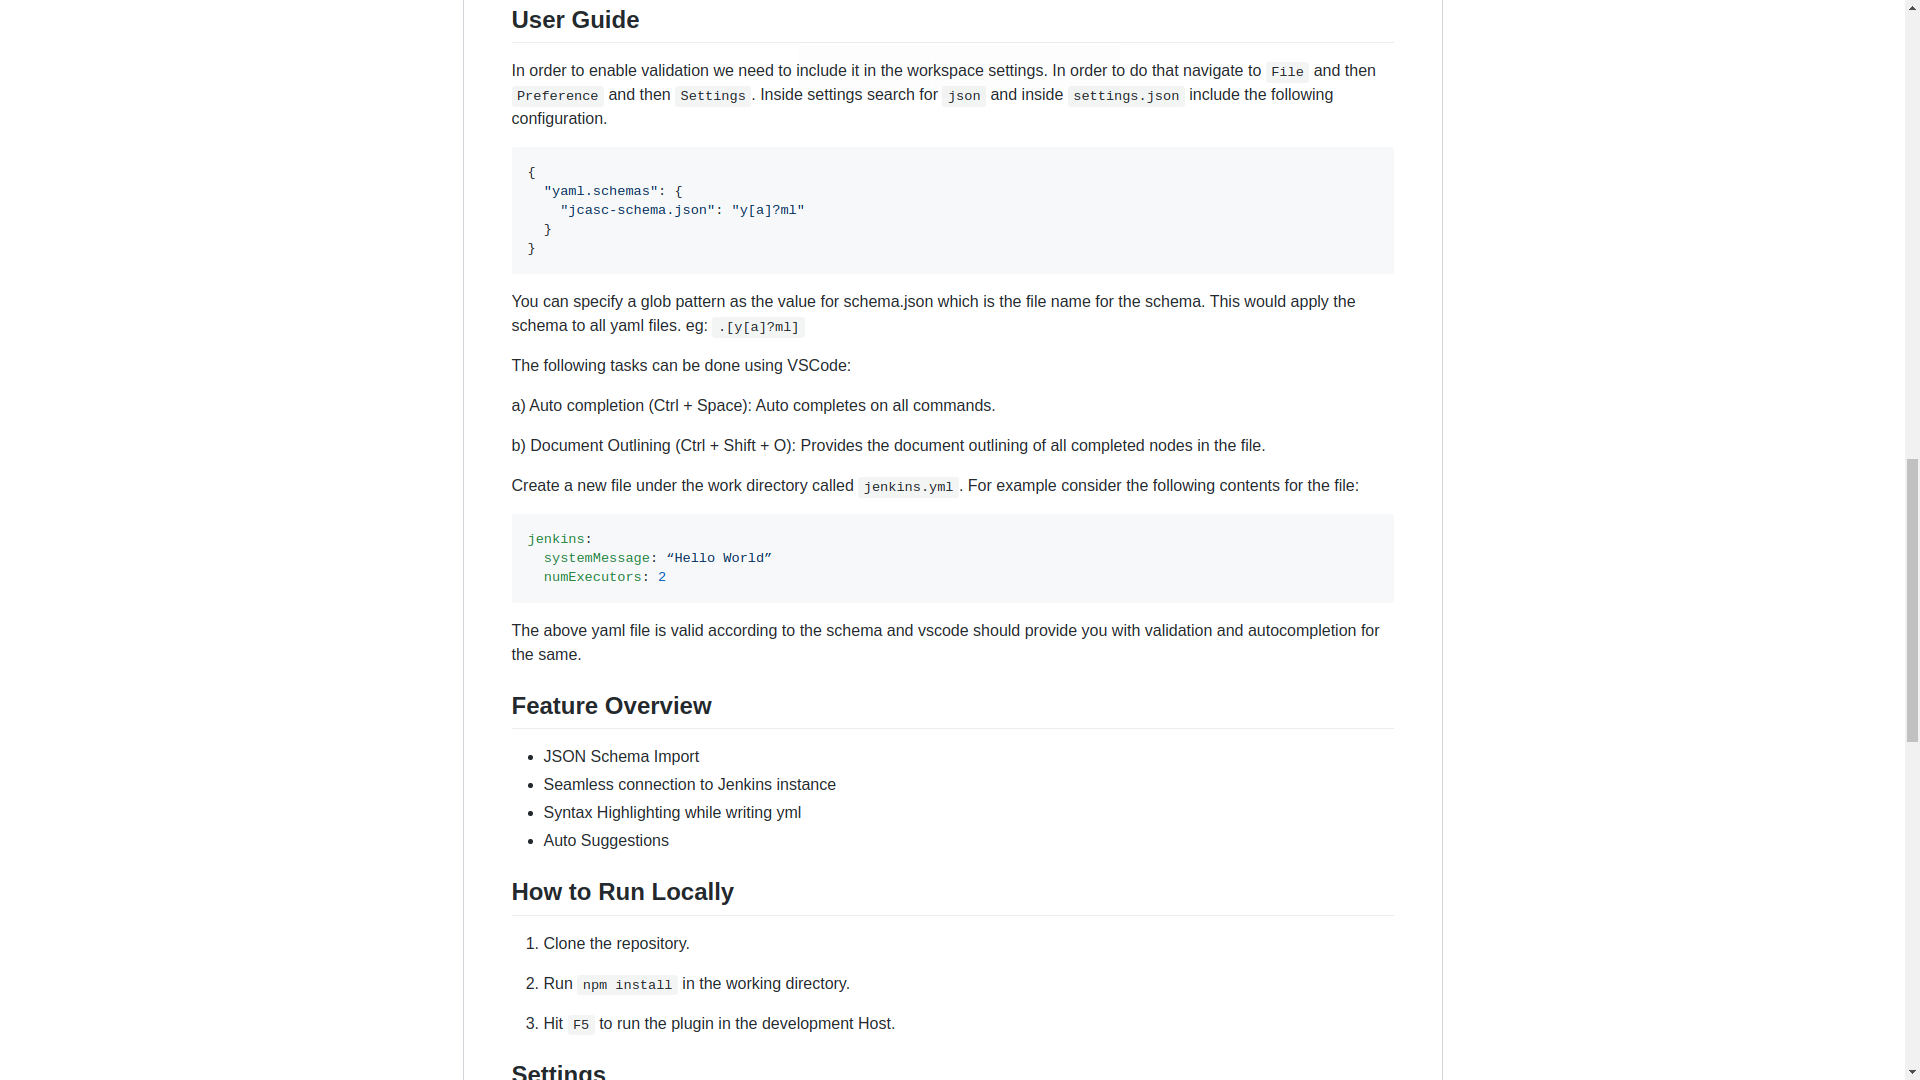
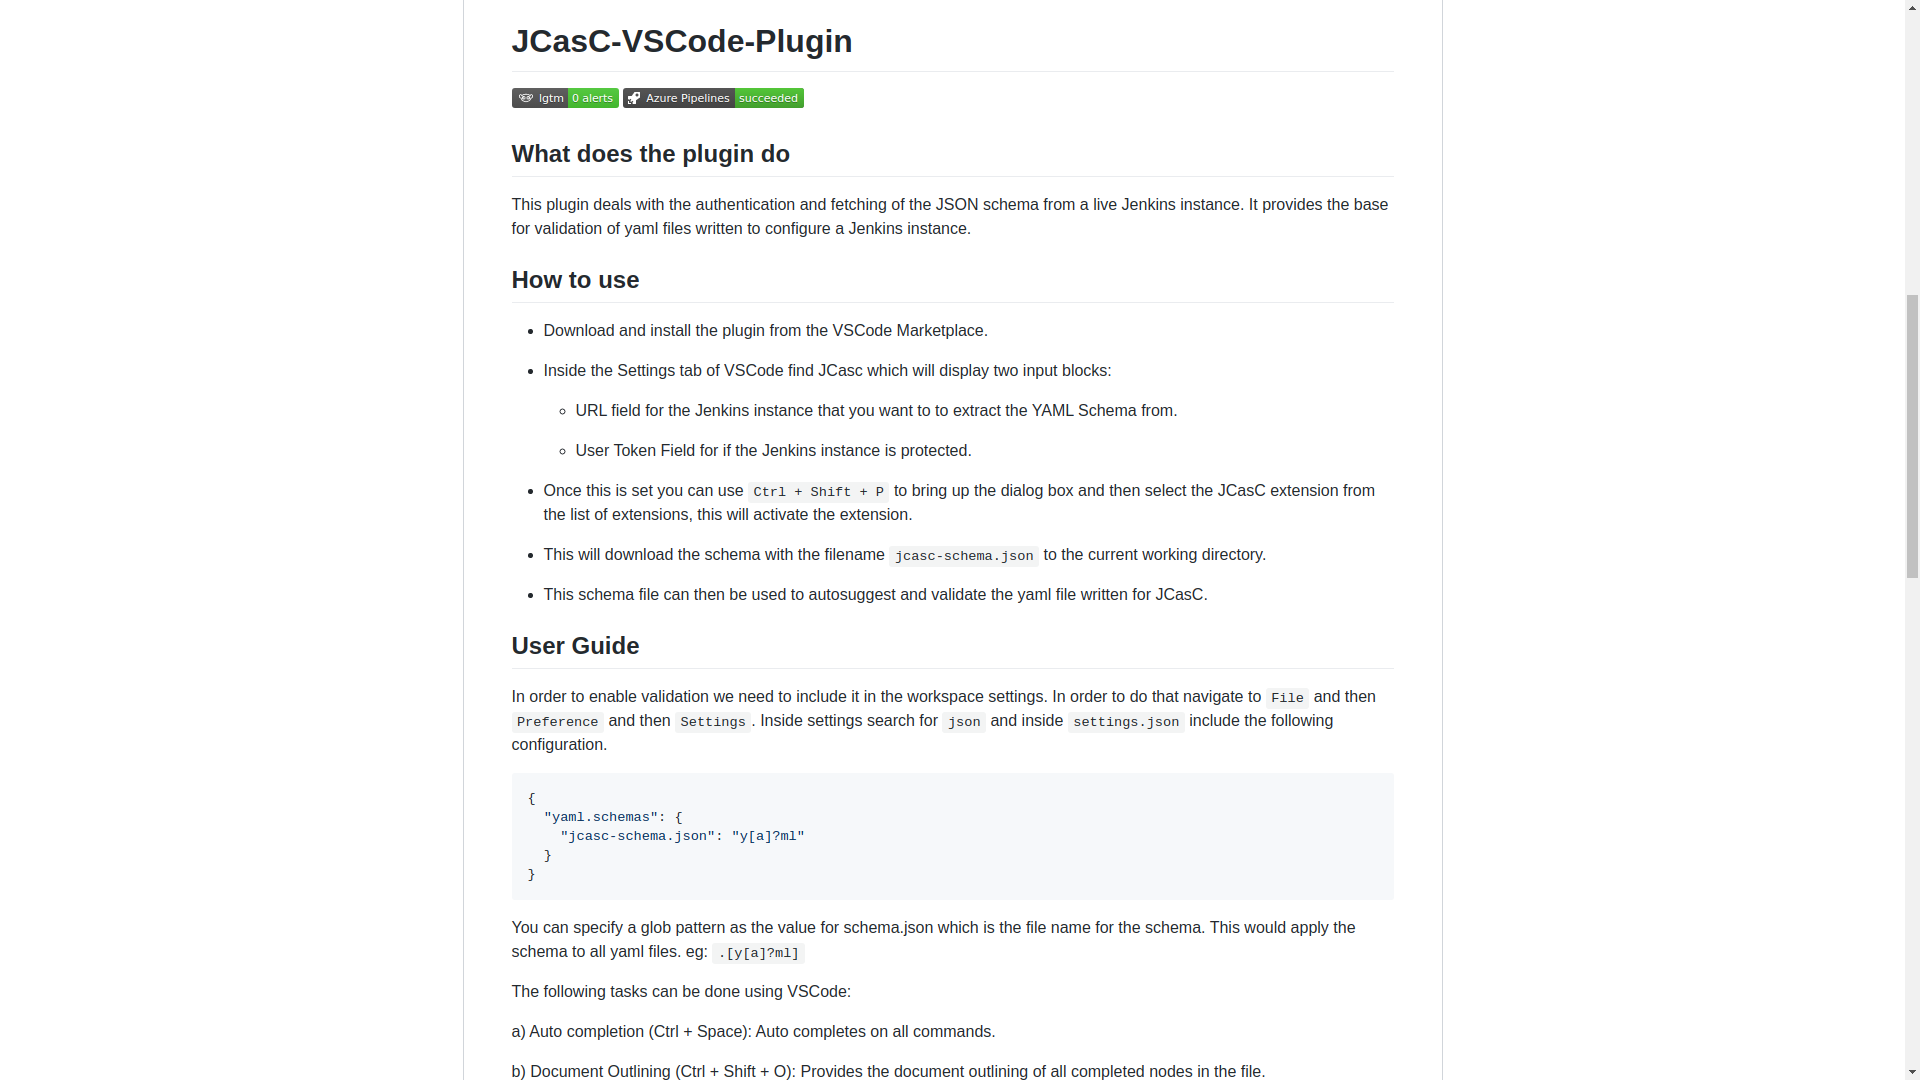
b) In order to enable validation we need to include it in the workspace settings. Navigate to File and then Preference and then Settings. Inside settings search for json and inside settings.json include the following configuration.

{
"yaml.schemas": {
        "schema.json": "y[a]?ml"
    }
}

You can specify a glob pattern as the value for schema.json which is the file name for the schema. This would apply the schema to all yaml files. eg: .[y[a]?ml]

c) The following tasks can be done using VSCode:

a) Auto completion (Ctrl + Space):
  Auto completes on all commands.
b) Document Outlining (Ctrl + Shift + O):
Provides the document outlining of all completed nodes in the file.

d) Create a new file under the work directory called jenkins.yml. For example consider the following contents for the file:

jenkins:
  systemMessage: “Hello World”
  numExecutors: 2
  1. The above yaml file is valid according to the schema and vscode should provide you with validation and autocompletion for the same.

Screenshots

vscode
userDocs1
userDocs2

We are holding an online meetup on the 26th February regarding this plugin and how you could use it to validate your YAML configuration files. For any suggestions or dicussions regarding the schema feel free to join our gitter channel. Issues can be created on Github.