Category

Project

Jenkins X and Kubernetes-native OSS Integration and Extension

By Blog, Project

CDF Newsletter – May 2020 Article
Subscribe to the Newsletter

By Kara de la Marck

Jenkins X is an automated CI/CD platform built on Kubernetes. Jenkins X enables users to harness the power of Kubernetes without needing to be Kubernetes experts. How does a CI/CD platform do this? Jenkins X forms an abstraction layer over Kubernetes, simplifying the developer experience of building, deploying, and running Kubernetes applications. Under the hood, Jenkins X combines best-of-breed open source tools, creating a Kubernetes-native CI/CD platform that facilitates developer and GitOps best practices. 

In this post, we’ll look at how Jenkins X uses Kubernetes Custom Resource Definitions (CRDs) and the Kubernetes API to bring together these best-of-breed open source projects, creating a cutting edge continuous delivery platform on Kubernetes. We’ll highlight two Kubernetes design principles that help us understand how Jenkins X natively extends Kubernetes:

  • Kubernetes API is declarative
  • Kubernetes has no hidden APIs

Kubernetes itself is decomposed into multiple components which interact through the Kubernetes API. Kubernetes’ declarative, API driven infrastructure enables it to be composable and extensible.

Kubernetes API is declarative

The Kubernetes API is declarative rather than imperative: as a user, you declare the desired state of your application and the Kubernetes system drives to make it so. One important benefit of this is automatic recovery. If something happens to your application, for example, a node crashes, then Kubernetes will restore the desired state.

Kubernetes has no hidden APIs

The Kubernetes API is exposed by the Kubernetes API server, which is a component of the Kubernetes control plane. The Kubernetes control plane is transparent in that there are no hidden internal APIs in Kubernetes: Kubernetes components interact through the same API that Kubernetes exposes to its users.

A declarative, API driven infrastructure

Kubernetes’ declarative, API driven infrastructure means that components, such as nodes, talk to the Kubernetes API server to figure out what their state ought to be. Instead of having the decision centralised and sent out, each node is responsible for its own health, and figuring out its desired behaviour. If a node fails and is brought back up, the newly created node can query the API server to figure out what it’s supposed to do.

The declarative way the Kubernetes API server communicates with remote nodes is in contrast to traditional client – server relationships, where the client tells the server what to do in an imperative manner and the server does it. Building the Kubernetes API server this way would have meant it grew as more functionality was added; the API server would have been brittle and difficult to extend.

Kubernetes is using a pattern called level triggered, which is generally opposed to edge triggered. In edge triggered systems the system responds to events, but if the system doesn’t receive an event, then the event needs to be replayed for the system to recover.

“If you are edge triggered you run risk of compromising your state and never being able to re-create the state. If you are level triggered the pattern is very forgiving, and allows room for components not behaving as they should to be rectified. This is what makes Kubernetes work so well.”

Joe Beda, as quoted in Cloud Native Infrastructure, by Justin Garrison and Kris Nova 

In Kubernetes, if any component goes down, when it comes back up, it requests the desired state from the Kubernetes API server and works to match that state. Components that can recover in this way tend to be more robust and the overall system is more reliable. This is especially true in distributed systems, where there are so many components in the system that the expectation is that there will always be components failing. Distributed systems need to be designed to tolerate the failure of components. If your system has one central manager component, which tells all the parts of the system what they should be doing, and that central manager component goes down, your system is down. Distributing that responsibility, so every component can figure out what it should be doing, makes the system more reliable. No longer is there a single point of failure. 

What happens when the Kubernetes API server, which acts as a central point, goes down? All the components will continue to operate on the last information they received. When the API server comes back up, the components will then operate on the new state if there were any changes. If any of the components go down, the other components can continue to function independently of that failure. When failed components come back up, they can read the state they should work towards from the API server.

These design choices make Kubernetes reliable. They also make Kubernetes very composable and extensible. Because all components use the same Kubernetes API as you do as an end user, you can replace any default component with your own. You can also add new components to enable new functionality. This extensibility has helped create a vibrant ecosystem of Kubernetes-native open source projects that like Jenkins X are built on Kubernetes using Kubernetes resources and the Kubernetes API machinery.

Custom Resource Definitions (CRDs)

Kubernetes is extended through Custom Resource Definitions (CRDs). A Kubernetes resource is an endpoint in the Kubernetes API that stores API objects of a certain type. Kubernetes uses API objects to represent the state of your cluster. 

To create your own custom Kubernetes API object type, define a new CRD of your type and define the schema. Then you can create your own objects against the Kubernetes API server. In this way, a custom resource extends the Kubernetes API: creating CRDs is like embedding your own APIs inside Kubernetes itself. To use the custom API objects you have created, you write your own custom controllers that act on the data contained in your custom object types. Kubernetes controllers are the mechanism by which Kubernetes reconciles the state state of your cluster to the state declared in the Kubernetes API.

How do CRDs relate to Kubernetes built-in types? Tim Hockin, co-founder of the Kubernetes project, has said, “If we had CRDs on day zero of Kubernetes there would be no built-in types.” If CRDs had existed from the start, pods and nodes and everything else would also be a CRD! 

If they weren’t part of the original design, why were CRDs created? CRDs were first created as a way to extend Kubernetes functionality to enable rapid prototyping. 

“That’s what fascinates me about CRD. It started as a prototyping tool. K8s API machinery was not intended to be a framework, but that is what shook out. If we did that intentionally we would have messed it up.”

– Tim Hockin, Twitter

It’s extremely interesting that CRDs, which started as a prototyping mechanism, are now the main resource definition mechanism in Kubernetes. This enables Kubernetes to be more modular, and many core Kubernetes functions are now built using custom resources. 

The Kubernetes API machinery is now distilled such that it can be used as API machinery for any project, not just Kubernetes. The extensible nature of the Kubernetes API enables higher level applications and platforms to be built on Kubernetes. Jenkins X  runs directly on Kubernetes, uses the Kubernetes API, and defines CRDs for its workflow. Moreover, the same Kubernetes API machinery that makes Kubernetes extensible also enables Kubernetes-native applications to integrate well with each other. Jenkins X both creates its own CRDs and integrates with other Kubernetes-native applications through the Kubernetes API to form a Kubernetes-native CI/CD platform.

Jenkins X High Level Architecture:

As seen in the diagram above, Jenkins X integrates with a number of open source projects such as TektonProw, and Vault, among others, to create an automated Kubernetes-native CI/CD platform. Jenkins X relies on CRDs to create new resources and extend the Kubernetes API. The Kubernetes API machinery enables Jenkins X to integrate with other open source projects through the Kubernetes API server.

Tekton, the pipeline execution engine for Jenkins X

Tekton is the pipeline execution engine for Jenkins X. Like Jenkins X, Tekton is Kubernetes-native and extends Kubernetes using CRDs. Jenkins X leverages Prow, or Jenkins X’s own Lighthouse, to signal to Tekton to run builds. Lighthouse is a lightweight webhook handler, which listens for Git webhook events and uses them to trigger Tekton PipelineRun CRDs for Tekton to use to perform builds. Tekton then generates a status update which Jenkins X communicates back to source code management providers, such as GitHub. 

The integration between Jenkins X as a CI/CD platform and Tekton as the execution engine for Jenkins X happens within Kubernetes using CRDs and the Kubernetes API. That both projects are Kubernetes-native enables them to seamlessly integrate using the Kubernetes API machinery.

“Tekton Pipelines lets us power Jenkins X’s execution and management of pipelines natively within Kubernetes.”

 – Andrew Bayer, Software Engineer, CloudBees, and creator of Jenkins X Pipeline Syntax

Tekton Pipelines for CD Interoperability

By Blog, Project

CDF Newsletter – May 2020 Article
Subscribe to the Newsletter

Contributed By Eric Sorenson

Tekton is a project that evolved from an internal Google tool that used Knative to build and deploy software. In 2018, it was spun out as an independent project and donated to the Continuous Delivery Foundation.

The core component, Tekton Pipelines, runs as a controller in a Kubernetes cluster. It registers several custom resource definitions which represent the basic Tekton objects with the Kubernetes API server, so the cluster knows to delegate requests containing those objects to Tekton. These primitives are fundamental to the way Tekton works. Tekton’s building block approach starts with the smallest atom of work, the Step, aggregates Steps together in Tasks, and aggregates Tasks together in Pipelines. 

If the nomenclature here feels confusing, don’t feel bad — it is complicated! Each tool in the space uses slightly different terms; this is something we’re working on standardizing in the CDF Interoperability SIG. We’d love your input – here’s how to participate! Tekton’s usage of these terms is clarified in the sig-interop Vocabulary definitions doc:

* *Step*: a specific function to perform.

* *Task*: is a collection of sequential steps you would want to run as part of your continuous integration flow. A task will run inside a pod on your cluster.

* *ClusterTask*: Similar to Task, but with a cluster scope.

* *Pipeline*: stateless, reusable, parameterized collection of tasks. Tasks are linked together in a Pipeline, which describes the end-to-end deployment for an application.

* *PipelineRun*: an instantiation of a Pipeline definition, filling in the Pipeline’s parameters with concrete values

* *Pipeline Resource*: objects that will be input to or output from tasks

* *Trigger*: Triggers is a Kubernetes Custom Resource Definition (CRD) controller that allows you to extract information from event payloads (a “trigger”) to create Kubernetes resources.

Notable omissions from the CRD list are “Steps”, which don’t have their own CRD because they’re the smallest unit of execution which are always contained inside a Task. The Conditions and Dashboard Extension CRDs are still optional and experimental — but very exciting!

Tekton’s approach is particularly interesting from a tool interoperability standpoint. By focusing on these building blocks and the concrete representation of them as declarative configuration, Tekton creates a standard platform for CD in the same way that Kubernetes provides a platform for application runtimes. This allows user-facing tools to build on the platform rather than reinventing these primitives. Several projects have already taken up this approach:

* Jenkins X uses Tekton as its execution engine. It’s been an option for a while now, but recently the project announced it was moving to using Tekton exclusively. Jenkins X provides pipeline definitions and gitops workflows that are tailored for cloud-native CD.

* Kabanero is a project that enables teams to develop and deploy applications on Kubernetes, so architects can provide pre-approved application stacks for developers to work from. It uses Tekton Pipelines and several associated projects like Tekton Dashboard and Triggers; indeed the developers building the Dashboard are largely working on Kabanero and the IBM Cloud Devops Pipeline product.

* Relay by Puppet is a hosted service that uses Tekton as the execution engine for event-triggered devops and deployment workflows. (Full disclosure, this is the product I am working on!) It provides a YAML dialect for building workflows that can be triggered by external events, via API, or manually, to automate tasks that need to stitch together different tools and services.

* TriggerMesh have integrated Tekton Pipelines into their TriggerMesh Cloud project and are working on a tool called Aktion to translate Github Actions into Tekton Pipelines.

* There are more, too! Check out the Tekton Friends repo for a longer list of projects and end users building on Tekton.

As exciting as this activity is, I think it’s important to note there’s still a lot of work to be done. There’s a distinct difference between two projects both using Tekton as a common upstream platform and achieving interoperability between them! It’s a big problem and it’s easy to get overwhelmed with the magnitude of the whole thing. One of my earliest lessons when I moved from SRE into product management was: focus first on solving the pain points which end users feel most acutely. That can be some combination of pervasiveness (what percent of the overall user base feels it?) and severity (how bad is each individual incident?) – ideally, fix the thing which is worst on both axes! From an end user’s standpoint, CD tools have a pretty steep learning curve with a bunch of pitfalls. A sampling of these severe-and-pervasive pitfalls I’ve heard from our users as we’ve been building Relay:

* How do I wrap my head around the terminology and technology so I can get started?

* How do I integrate the parts of the build/test/deploy toolchain my organization needs to continue using?

* How do I operate (upgrade, monitor, troubleshoot) the tool once it’s up and running?

Interoperability isn’t a cure-all, but there are definitely areas where it could work like a soothing balm on all of this pain. Industry-standard terminology or at a minimum, an authoritative Rosetta Stone for CD, could help. At the moment, there’s still pockets of debate on whether the “D” stands for Deployment or Delivery! (It’s “Delivery”, folks – when you mean “Deployment” you have to spell it out.)

Going deeper, it’d be hugely helpful help users integrate the tools they’re already using into a new framework. A wide ecosystem of steps that could be used by any of the containerized CD tools – not just those based on Tekton but, for example, Spinnaker and Keptn as well – would have a number of benefits. For end users, it would increase the amount of content available “out of the box”, meaning they would have less work to integrate the tools and services they need. Ideally, no end-user should have to create a step from scratch because there’s a vast, easily discoverable library of things that accomplish the job they have. There’s also a benefit to maintainers of services and tools that end-users want, like Kaniko, Gradle, and the cloud services, who have to build an integration with each execution framework themselves or rely on the community to do it. Building and maintaining one reusable implementation would reduce the maintenance burden and allow them to provide higher quality. 

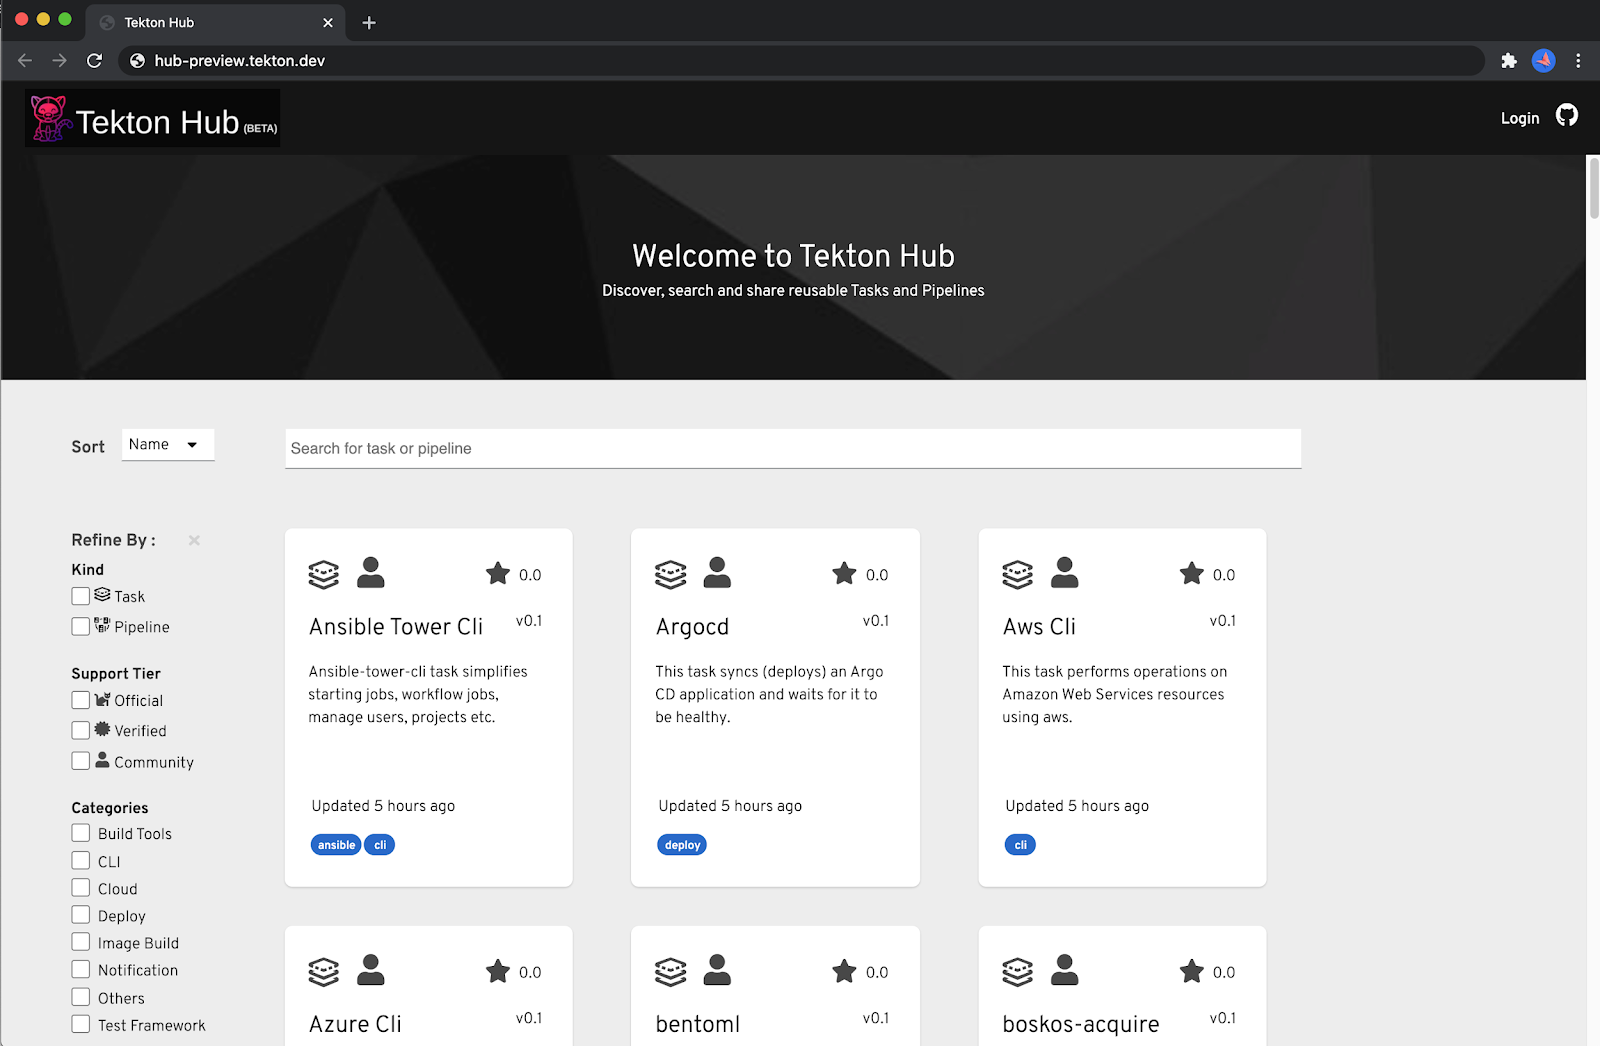
To put on my Tekton advocate hat for a moment, its well-defined container contract makes it easy to use general-purpose containers in your pipeline. If you want to take advantage of more specialized features the framework provides, the Tekton Catalog has a number of high-quality examples to build from. There are improvements on the way to aid the discoverability and reuse parts of the problem, such as the exciting new Tekton Hub donated by Red Hat. 

The operability concerns are a real problem for CD pipeline tools, too. Although CD is usually associated with development, in many organizations the tool itself is considered a production service, because if there are problems committing, building, testing, and shipping code, the engineering organization isn’t delivering value. Troubleshooting byzantine failures in complex CI/CD pipelines is a specialized discipline requiring skills that span Quality Engineering, SRE, and Development. The more resilient the CD tools are architected, and the more standard their interfaces for reporting availability and performance metrics, the easier that troubleshooting becomes. 

Again, to address these from Tekton’s perspective, a huge benefit of running on Kubernetes is that the Tekton services that run in the cluster can take advantage of all the powerful k8s operability features. So fundamental capabilities that are highly valuable to operators and troubleshooters like log aggregation, in-place upgrades, error reporting, and scale-out all ride on top of the Kubernetes infrastructure. It’s not “for free” of course; nothing in distributed systems is ever truly “for free” and if anyone tries to tell you otherwise, the thing they’re selling you is probably *very* expensive. But it does mean that general-purpose Kubernetes skills and tooling goes a long way towards operating Tekton at scale, rather than having to relearn or reimplement them at the application layer.

In conclusion, I’m excited that the interoperability conversation is well underway at the CDF. There’s a long way to go, but the amount of activity and progress in the space is very encouraging. If you’re interested in pitching in to discuss and solve these kinds of problems, please feel free to join in #sig-interoperability channel on the CDF slack or check out the contribution information

From Jenkins – GitHub App authentication support released

By Blog, Project

Originally posted on the Jenkins blog by Tim Jacomb

I’m excited to announce support for authenticating as a GitHub app in Jenkins. This has been a long awaited feature by many users.

It has been released in GitHub Branch Source 2.7.0-beta1 which is available in the Jenkins experimental update center.

Authenticating as a GitHub app brings many benefits:

  • Larger rate limits – The rate limit for a GitHub app scales with your organization size, whereas a user based token has a limit of 5000 regardless of how many repositories you have.
  • User-independent authentication – Each GitHub app has its own user-independent authentication. No more need for ‘bot’ users or figuring out who should be the owner of 2FA or OAuth tokens.
  • Improved security and tighter permissions – GitHub Apps offer much finer-grained permissions compared to a service user and its personal access tokens. This lets the Jenkins GitHub app require a much smaller set of privileges to run properly.
  • Access to GitHub Checks API – GitHub Apps can access the the GitHub Checks API to create check runs and check suites from Jenkins jobs and provide detailed feedback on commits as well as code annotation

Getting started

Install the GitHub Branch Source plugin, make sure the version is at least 2.7.0-beta1. Installation guidelines for beta releases are available here

Configuring the GitHub Organization Folder

Follow the GitHub App Authentication setup guide. These instructions are also linked from the plugin’s README on GitHub.

Once you’ve finished setting it up, Jenkins will validate your credential and you should see your new rate limit. Here’s an example on a large org:

GitHub app rate limit

How do I get an API token in my pipeline?

In addition to usage of GitHub App authentication for Multi-Branch Pipeline, you can also use app authentication directly in your Pipelines. You can access the Bearer token for the GitHub API by just loading a ‘Username/Password’ credential as usual, the plugin will handle authenticating with GitHub in the background.

This could be used to call additional GitHub API endpoints from your pipeline, possibly the deployments api or you may wish to implement your own checks api integration until Jenkins supports this out of the box.

Note: the API token you get will only be valid for one hour, don’t get it at the start of the pipeline and assume it will be valid all the way through

Example: Let’s submit a check run to Jenkins from our Pipeline:

pipeline {
  agent any

  stages{
    stage('Check run') {
      steps {
        withCredentials([usernamePassword(credentialsId: 'githubapp-jenkins',
                                          usernameVariable: 'GITHUB_APP',
                                          passwordVariable: 'GITHUB_JWT_TOKEN')]) {
            sh '''
            curl -H "Content-Type: application/json" \
                 -H "Accept: application/vnd.github.antiope-preview+json" \
                 -H "authorization: Bearer ${GITHUB_JWT_TOKEN}" \
                 -d '{ "name": "check_run", \
                       "head_sha": "'${GIT_COMMIT}'", \
                       "status": "in_progress", \
                       "external_id": "42", \
                       "started_at": "2020-03-05T11:14:52Z", \
                       "output": { "title": "Check run from Jenkins!", \
                                   "summary": "This is a check run which has been generated from Jenkins as GitHub App", \
                                   "text": "...and that is awesome"}}' https://api.github.com/repos/<org>/<repo>/check-runs
            '''
        }
      }
    }
  }
}

What’s next

GitHub Apps authentication in Jenkins is a huge improvement. Many teams have already started using it and have helped improve it by giving pre-release feedback. There are more improvements on the way.

There’s a proposed Google Summer of Code project: GitHub Checks API for Jenkins Plugins. It will look at integrating with the Checks API, with a focus on reporting issues found using the warnings-ng plugin directly onto the GitHub pull requests, along with test results summary on GitHub. Hopefully it will make the Pipeline example below much simpler for Jenkins users 🙂 If you want to get involved with this, join the GSoC Gitter channel and ask how you can help.

Tekton: Wow! We’re beta now!

By Blog, Project

You may have heard that Tekton Pipelines is now beta! That’s not beta like the video format but beta like Kubernetes! Okay I’ll stop trying to make jokes, because compatibility is no laughing matter for folks who want to build on top of and use Tekton, and that’s why we’ve declared beta, so that you can feel more confident in using it.

What exactly does beta mean for Tekton?

So what does beta mean exactly? It means for Tekton what it means for Kubernetes, and it boils down to two things:

  1. Features that are beta will not be removed; they might change but you can count on the features themselves sticking around
  2. Backwards incompatible changes to the API will be avoided; if they do have to happen you will be given at least 9 months worth of releases to migrate to the new way of doing things

You might be wondering what “the API” means in this context – good question! It’s the specifications of the CRDs themselves and runtime details like the special directories that Tekton makes.

Not all of Tekton is beta however! Right now it’s just Tekton Pipelines and it’s only the following CRDs:

  • Tasks, ClusterTasks and TaskRuns
  • Pipelines and PipelineRuns


This means that other types that you might like, such as Conditions and PipelineResources (see the next section!) are still alpha and don’t (yet!) have the same beta level guarantees.

You can always refer to our API compatibility docs in our repo if you forget!

What about PipelineResources?

What about them indeed! If you are part of the Tekton community, you’ll know that we keep going back and forth on our love/hate-able PipelineResources – the feature you love until it doesn’t work.

A few months ago, our “difficult to understand, hard to debug” friend was challenged by the community: what would the Tekton world look like without PipelineResources? And when we went on that journey, we discovered features which PipelineResources gave us which were super useful on their own:

So we focused on adding those features and brought them to beta. In the meantime, we keep asking the question: do we still need PipelineResources? And what would they look like if redesigned with workspaces and results? We’re still asking those questions and that’s why PipelineResources aren’t beta (yet)!

We know some users really love them: “There are dozens of us,” – @dlorenc. So we haven’t given up on them yet, and there are some things that you just still can’t do well without them: for example, how do you consistently represent artifacts such as images moving through Pipelines? You can’t! So the investigation continues.

In the meantime, we’ve made Task equivalents of some of our PipelineResources in the Tekton catalog, such as PullRequests, GCS, and git.

Tekton Website is Live Now!

Hooray! Our shiny new site is live! Right this way -> https://tekton.dev/

Tekton Documentation is now hosted on the website at https://tekton.dev/docs/. And interactive tutorials are hosted at https://tekton.dev/try/. There is just one interactive tutorial hosted right now but more are in process to get published, so watch this space!

What’s coming up next?

We’re hard at work on more nifty Tekton stuff to make your CI/CD Pipelines more powerful and more portable by achieving Tekton’s mission:

Be the industry-standard, cloud-native CI/CD platform components and ecosystem.

Check out more on our mission and our 2020 roadmap in our community repo.

THANK YOU!!! ❤️

Thanks to all of the many amazing contributors who have gotten us to this point! The list below is people credited in Tekton Pipelines release notes, but for the complete list of everyone contributing to Tekton check out our devstats!

From Jenkins – Validating JCasC configuration files using Visual Studio Code

By Blog, Project

Originally posted on the Jenkins Blog by Sladyn Nunes

Configuration-as-code plugin

Problem Statement: Convert the existing schema validation workflow from the current scripting language in the Jenkins Configuration as Code Plugin to a Java based rewrite thereby enhancing its readablity and testability supported by a testing framework for the same. Enhance developer experience by developing a VSCode Plugin to facilitate autocompletion and validation which would help the developer write correct yaml files before application to a Jenkins Instance.

The Configuration as Code plugin has been designed as an opinionated way to configure Jenkins based on human-readable declarative configuration files. Writing such a file should be feasible without being a Jenkins expert, just translating into code a configuration process one is used to executing in the web UI. The plugin uses a schema to verify the files being applied to the Jenkins instance.

With the new JSON Schema being enabled developers can now test their yaml file against it. The schema checks the descriptors i.e. configuration that can be applied to a plugin or Jenkins core, the correct type is used and help text is provided in some cases. VSCode allows us to test out the schema right out of the box with some modifications. This project was built as part of the Community Bridge initiative which is a platform created by the Linux Foundation to empower developers — and the individuals and companies who support them — to advance sustainability, security, and diversity in open source technology. You can take a look at the Jenkins Community Bridge Project Page

Steps to Enable the Schema Validation

a) The first step includes installing the JCasC Plugin for Visual Studio Code and opening up the extension via the extension list. Shortcut for opening the extension list in VSCode editor using Ctrl + Shift + X.

b) In order to enable validation we need to include it in the workspace settings. Navigate to File and then Preference and then Settings. Inside settings search for json and inside settings.json include the following configuration.

{
"yaml.schemas": {
        "schema.json": "y[a]?ml"
    }
}

You can specify a glob pattern as the value for schema.json which is the file name for the schema. This would apply the schema to all yaml files. eg: .[y[a]?ml]

c) The following tasks can be done using VSCode:

a) Auto completion (Ctrl + Space):
  Auto completes on all commands.
b) Document Outlining (Ctrl + Shift + O):
Provides the document outlining of all completed nodes in the file.

d) Create a new file under the work directory called jenkins.yml. For example consider the following contents for the file:

jenkins:
  systemMessage: “Hello World”
  numExecutors: 2
  1. The above yaml file is valid according to the schema and vscode should provide you with validation and autocompletion for the same.

Screenshots

vscode
userDocs1
userDocs2

We are holding an online meetup on the 26th February regarding this plugin and how you could use it to validate your YAML configuration files. For any suggestions or dicussions regarding the schema feel free to join our gitter channel. Issues can be created on Github.

From Jenkins X – Asking and Finding Help: Outreachy

By Blog, Project

Originally posted on the Jenkinx X blog by Neha Gupta

Neha Gupta is adding support for Kustomize in Jenkins X, to enable Kubernetes native configuration management, while participating in Outreachy from December 2019 to March 2020.

Outreachy open-source contribution for applicants — Asking/Finding help

This blog might be helpful for beginners who are fear-stricken or I would say hesitant to ASK, to get lost in the new world while trying to understand any open source project, fear of asking questions that may sound stupid later on or are very obvious! First of all.. Relax!

  • Everyone starts from somewhere and has a learning curve!..
  • There are some pre-requisites that may help you get into open-source development better..
  • Learn basics of git operations. (https://learngitbranching.js.org , I find this easy and helpful).
  • Try to find an open-source project (remember : you’re going to contribute to a part of it, so it’s okay if some/many things doesn’t make sense in the beginning, because it’s easier to write code than to understand someone else’s code).
  • For selecting a project you may also look for Google-Summer-of-Code, Outreachy, Google-Code-In, RSoC and other open-source programs and their organisations that helps people/students/aspiring developers to find your best interest communities and projects.

NOTE : Beware! seeing too many organisations and projects will only confuse you, so start with only one or max 2 projects, try to deep-dive and focus on them.

After selecting the project :

  • Connect with the community through their communication channels for both developers and users (example : Slack, IRC-Cloud, Zulip, Riot etc )
  • Try to read the documentation and understand the overall structure and purpose of the project you’re starting to work on.
  • If you don’t understand something functionality wise — just ask! Ask on the communication channel.
  • If you are facing any error — Google search it, or try to look into the existing issues, if you’re not able to move forward and you’re stuck on the same error for more than 45 mins, just ask! Trust me! There’s no harm. In-fact, people of open-source communities appreciate it, feels motivated when there are users asking them about something that they’re passionately building. It also sometimes, helps the community to re-define and re-align the product and some features.

Happy learning! 🙂

From Jenkins X – Outreachy: Motivation to apply!

By Blog, Project

Originally posted on the Jenkins X blog by Neha Gupta

Neha Gupta is adding support for Kustomize in Jenkins X, to enable Kubernetes native configuration management, while participating in Outreachy from December 2019 to March 2020.

Motivation to apply to Outreachy:

In my graduation class of fifty people we were three girls struggling to set up our space and comfort with the weird reactions we got from fellow students for trying to understand technology. When my professor asked us to make an autonomous drone. I couldn’t make one, I was shattered, until a friend from computer science batch helped me make one. He showed me some of the cool apps he made, that sparked an interest, and I started building apps, realising that computer science is beyond just coding, it’s more about solving real life problems.

I’ve transitioned from mobile to web apps, server-end development, robotics, cloud architecting, and also cofounding a startup. I’ve been focusing on using AI to make smarter apps, and help students think beyond, and see the bigger picture. I’m hoping to start an accelerator, regulating the perception about technology, focusing especially on hidden potential behind fear-stricken girls.

When I heard about Outreachy program and I liked how women and other minority communities are being supported and motivated. It felt something similar to what I’m trying to do with the young girls around me (breaking the stereotypical phenomenon of “girls can’t code”). I felt participating in Outreachy will not only boost my but other girls motivation too! and it’ll also definitely help me grow technologically, socially and mentally.

Why excited about Outreachy?

To me it feels really cool to work with a team remotely. The interactions, networking and feel is completely different, especially when it’s open-source (Like ..I get anxious before asking questions on public channels, if the question is too logical and stupid). Also, I’m a fan of open-source contributions, so… (here was the chance).

Another reason was to interact with the minority community (people who are facing similar issues in STEM like me) and share some instances with them, be on the same page, enlighten and get enlightened (all that networking sounds fun..). I am also excited about the trip. Why Jenkins-X?

The Cloud Storage backed Helm repository idea seemed interesting, so I started exploring it. The project was also quite different from other listed (maybe because it was meant for me 😀 ), I only contributed to it and focused on it.

Also the community was very welcoming and communications with my mentor were good. He helped me making contributions to the project, he guided me to some good first issues, helped me correct my PR’s. Jenkins-X looked as an interesting open-source project so I’m glad I tried to be a part of it and got selected.

What would I tell someone who is worried about applying to Outreachy?

If you are someone who has just started open source contributions and are fear stricken on how is it gonna work? These all things seems so confusing and you’re overwhelmed.

Don’t worry! ..

I was too! Every one is.. and this is just step — 1. Anyone who’s going to pick up a new project which is production ready and thousands/millions of people are using it, is going to be confused! This is normal and natural (the initial learning curve), but once you overcome it. Things become so normal and understanding, people are here to help you out.

If you think you can’t make it because of the competition, how does matter? If not this time, next time (I myself got selected after 3 years of trying), you anyway has to start one day, so let it be today. But the learnings you take away from the process, are insanely valuable and every-time it’s gonna become easier.. Feel free to reach me if you are facing any issues regarding starting with open-source contributions or if you have question saying — shall I apply to Outreachy this time?

Good Luck! 🙂

From Jenkins – WebSocket

By Blog, Project

Originally posted on the Jenkins blog by Jesse Glick

I am happy to report that JEP-222 has landed in Jenkins weeklies, starting in 2.217. This improvement brings experimental WebSocket support to Jenkins, available when connecting inbound agents or when running the CLI. The WebSocket protocol allows bidirectional, streaming communication over an HTTP(S) port.

While many users of Jenkins could benefit, implementing this system was particularly important for CloudBees because of how CloudBees Core on modern cloud platforms (i.e., running on Kubernetes) configures networking. When an administrator wishes to connect an inbound (formerly known as “JNLP”) external agent to a Jenkins master, such as a Windows virtual machine running outside the cluster and using the agent service wrapper, until now the only option was to use a special TCP port. This port needed to be opened to external traffic using low-level network configuration. For example, users of the nginx ingress controller would need to proxy a separate external port for each Jenkins service in the cluster. The instructions to do this are complex and hard to troubleshoot.

Using WebSocket, inbound agents can now be connected much more simply when a reverse proxy is present: if the HTTP(S) port is already serving traffic, most proxies will allow WebSocket connections with no additional configuration. The WebSocket mode can be enabled in agent configuration, and support for pod-based agents in the Kubernetes plugin is coming soon. You will need an agent version 4.0 or later, which is bundled with Jenkins in the usual way (Docker images with this version are coming soon).

Another part of Jenkins that was troublesome for reverse proxy users was the CLI. Besides the SSH protocol on port 22, which again was a hassle to open from the outside, the CLI already had the ability to use HTTP(S) transport. Unfortunately the trick used to implement that confused some proxies and was not very portable. Jenkins 2.217 offers a new -webSocket CLI mode which should avoid these issues; again you will need to download a new version of jenkins-cli.jar to use this mode.

The WebSocket code has been tested against a sample of Kubernetes implementations (including OpenShift), but it is likely that some bugs and limitations remain, and scalability of agents under heavy build loads has not yet been tested. Treat this feature as beta quality for now and let us know how it works!

From Jenkins – Atlassian’s new Bitbucket Server integration for Jenkins

By Blog, Project

Originally posted on the Jenkins blog by Daniel Kjellin

We know that for many of our customers Jenkins is incredibly important and its integration with Bitbucket Server is a key part of their development workflow. Unfortunately, we also know that integrating Bitbucket Server with Jenkins wasn’t always easy – it may have required multiple plugins and considerable time. That’s why earlier this year we set out to change this. We began building our own integration, and we’re proud to announce that v1.0 is out.

The new Bitbucket Server integration for Jenkins plugin, which is built and supported by Atlassian, is the easiest way to link Jenkins with Bitbucket Server. It streamlines the entire set-up process, from creating a webhook to trigger builds in Jenkins, to posting build statuses back to Bitbucket Server. It also supports smart mirroring and lets Jenkins clone from mirrors to free up valuable resources on your primary server.

Our plugin is available to install through Jenkins now. Watch this video to find out how, or read the BitBucket Server solution page to learn more about it.

Once you’ve tried it out we’d love to hear any feedback you have. To share it with us, visit https://issues.jenkins-ci.org and create an issue using the component atlassian-bitbucket-server-integration-plugin.

Screwdriver: Introducing Queue Service

By Blog, Project
Introducing Queue Service

Pritam Paul, Software Engineer, Verizon Media

We have recently made changes to the underlying Screwdriver Architecture for build processing. Previously, the executor-queue was tightly-coupled to the SD API and worked by constantly polling for messages at specific intervals. Due to this design, the queue would block API requests. Furthermore, if the API crashed, scheduled jobs might not be added to the queue, causing cascading failures.

Hence, keeping the principles of isolation-of-concerns and abstraction in mind, we designed a more resilient REST-API-based queueing system: the Queue Service. This new service reads, writes and deletes messages from the queue after processing. It also encompasses the former capability of the queue-worker and acts as a scheduler.

Authentication

The SD API and Queue Service communicate bidirectionally using signed JWT tokens sent via auth headers of each request.

Build Sequence
image
Design Document

For more details, check out our design spec.

Using Queue Service

As a cluster admin, to configure using the queue as an executor, you can deploy the queue-service as a REST API using a screwdriver.yaml and update configuration in SD API to point to the new service endpoint:

# config/default.yaml
ecosystem:
    # Externally routable URL for the User Interface
    ui: https://cd.screwdriver.cd

    # Externally routable URL for the Artifact Store
    store: https://store.screwdriver.cd

    # Badge service (needs to add a status and color)
    badges: https://img.shields.io/badge/build–.svg

    # Internally routable FQDNS of the queue service
    queue: http://sdqueuesvc.screwdriver.svc.cluster.local

executor:
    plugin: queue
    queue: “

For more configuration options, see the queue-service documentation.

Compatibility List

In order to use the new workflow features, you will need these minimum versions:

  • UI – v1.0.502
  • API – v0.5.887
  • Launcher – v6.0.56
  • Queue-Service – v1.0.11
Contributors

Thanks to the following contributors for making this feature possible:

Questions and Suggestions

We’d love to hear from you. If you have any questions, please feel free to reach out here. You can also visit us on Github and Slack.