

Contributed by Steve Fenton, Octopus Deploy

DORA has been researching software delivery for over a decade, but most people are familiar with their work through their famous four key metrics. This post will help you understand how the metrics have changed and why. I also want to encourage more people to go deeper than the metrics, as the research has so much more to offer.
The idea behind the DORA metrics is that they provide an objective way to understand your software delivery process. The metrics apply to a team and application, providing a strong signal of where teams should focus if they want to make a meaningful improvement.
The long-standing metrics
The 4 keys have been around for a while, and you may already be familiar with them. They represent two categories, throughput and stability. Before DevOps arrived, most organizations considered these to be a trade-off. If you increased throughput, the result would be instability. However, when you align development and operations around the same goals, you quickly find that the things they do to improve throughput also increase stability.
For example, manual deployments are out if you want to deploy frequently. They just take too long. So, you automate the deployment to make it faster. When you do this, you also make the deployment more reliable, more repeatable, and much less stressful. You intended to increase throughput, but you also improved stability. It’s “win-squared”.
This is why culture, automation, lean software development, measurement, and sharing combine in DevOps to create such a shockwave of positive change. It breaks the traditional conflict between developers who want to introduce more change, and operations who resist the change to maintain a stable system.
Let’s examine the long-standing four keys.
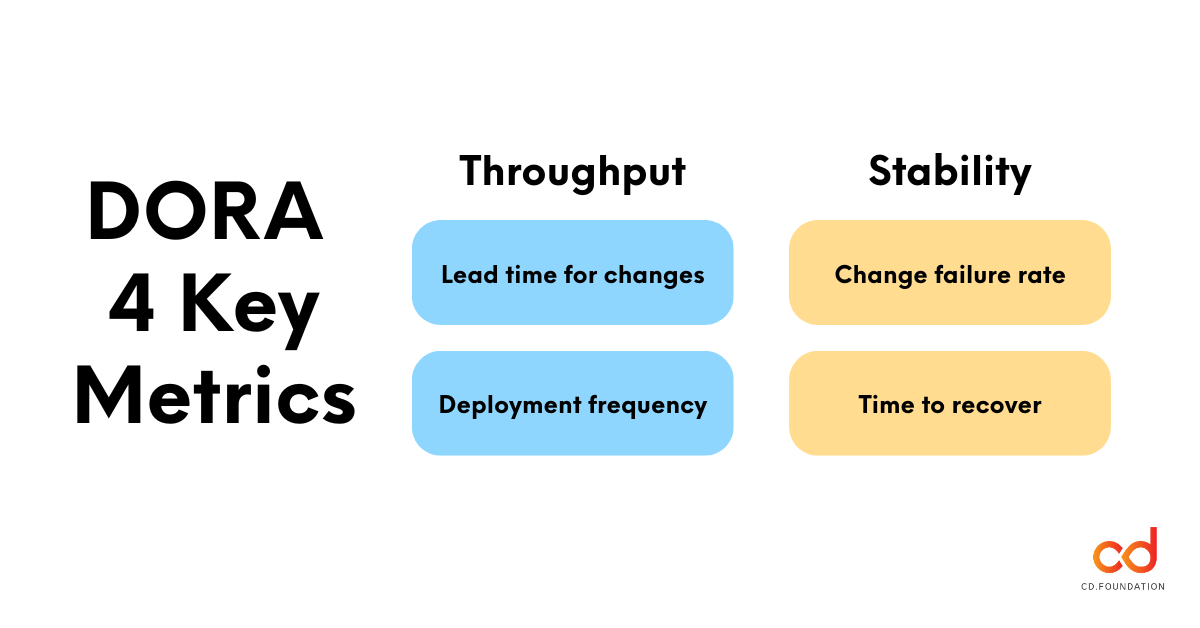
Throughput
- Lead time for changes: The time it takes for a code change to reach the live environment.
- Deployment frequency: How often you deploy to production or to end users.
Stability
- Change failure rate: The percentage of changes resulting in a fault, incident, or rollback.
- Time to recover: How long it takes to get back into a good state after a bad deployment.
The combination of these 4 metrics helps you solve problems in healthy ways. While you could increase deployment frequency by making someone a full-time copy-and-paste hero, you’d likely see an adverse effect on stability metrics, as the manual process invites accidents.
Metrics are better than blank walls
Blank wall retrospectives are often used to drive the improvement process. The team will undoubtedly come up with ideas that improve their experience. Any motivated team of people will find ways to enhance their software delivery. Often, though, these improvements don’t translate into improved outcomes.
The DORA metrics can help with this. Using measures for throughput (the flow of features) and stability (the ability to deliver without disruption), they identify specific areas that need improvement, and the statistical model of practices and capabilities produced by the research offers many ideas on what specific changes you could experiment with to improve things.
This creates a complete feedback loop. For example, the metrics may highlight that you have a high change failure rate. If you frequently have to scramble to fix problems each time you deploy, you’ll disrupt the flow of valuable work, upset the software’s users, and damage your team’s reputation within your organization.
When an organization doesn’t trust a development team, it starts adding heavyweight change control practices and irritating procedures. Nobody wants this because the research found that this leads to even worse outcomes than those that made people want to assert more control.
So, the best way to use the metrics is within the team as part of the continuous improvement process. The numbers tell you where to look, the statistical model has some suggestions on how to improve (and you’ll have your own ideas, too), and you run an experiment to see if making a change to how you’re working results in an improvement.
The evolved metrics
The updated metrics used in more recent reports still have a similar shape to the 4 keys. Throughput and stability remain the dual goals of the measurement system, and the same practices will continue to improve them. They just represent the world more clearly.
Let’s look at the evolved version of the metrics.
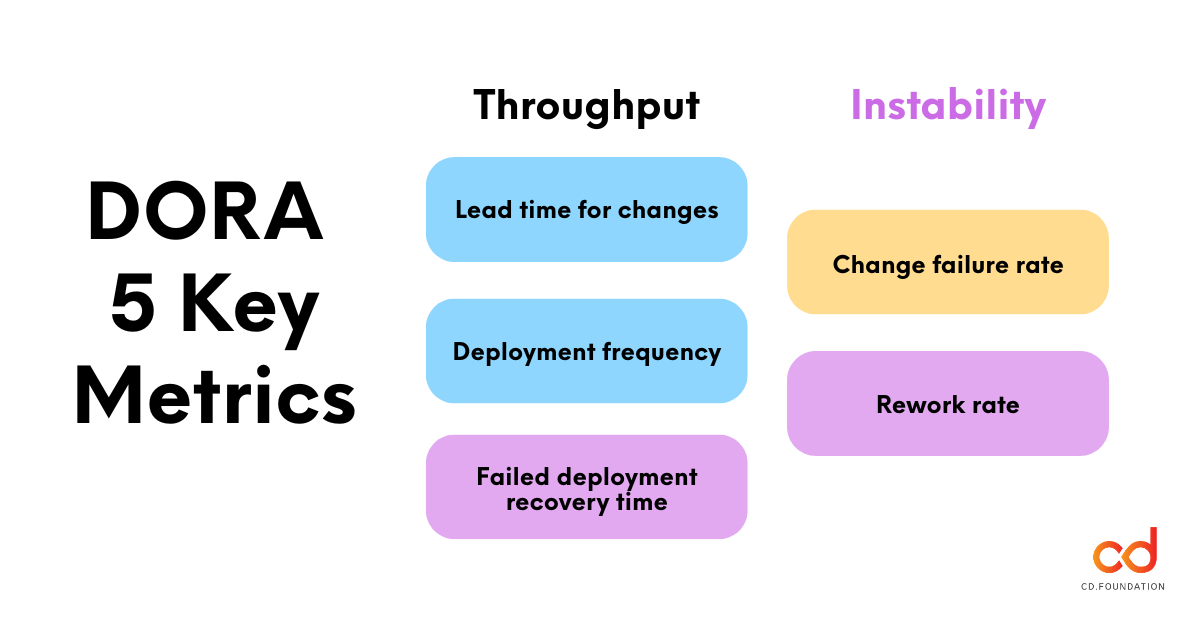
Throughput
- Lead time for changes: The time it takes for a code change to reach the live environment.
- Deployment frequency: How often you deploy to production or to end users.
- Failed deployment recovery time: How long it takes to get back into a good state after a bad deployment.
Instability
- Change failure rate: The percentage of changes resulting in a fault, incident, or rollback.
- Rework rate: The ratio of unplanned deployments that happen due to a production issue.
The first change is that the recovery time has moved from stability to throughput. This is sensible, as teams with a short lead time for changes can progress fixes quickly without needing to use an expedited process. When organizations depend on shortcuts to get emergency fixes deployed, they tend to introduce more problems than they solve.
Next up, the stability category has been renamed to instability. That’s because a high change failure rate or rework rate are signs of instability. Their absence doesn’t necessarily confirm stability, because they don’t necessarily capture all kinds of instability. An example might help here. If you have a high temperature, it’s a sign that you’re unwell. However, having a normal temperature doesn’t necessarily mean you’re healthy.
And finally, rework rate is a new metric. You’d measure this by tracking the number of deployments and the number of unplanned deployments. The rework rate is the number of unplanned deployments divided by the total number of deployments. For example, if you deployed 10 times and 3 of these were unplanned deployments, you’d use 3 divided by 10, to get a rework rate of 0.3 (or 30%).

How this impacts your measurement initiative
If you’re using the 4 keys and it still helps you get better at getting better, there’s no need to rush to update your metrics. You may already be capturing the signal on rework rate through your change failure rate, so you don’t have many dark corners to worry about.
A more useful addition to your measurement strategy is to look at the other boxes in the DORA model. There are metrics for reliability and well-being that offer opportunities to improve operational performance and culture, which makes your improvement efforts more holistic. When you reach beyond software delivery performance, you’ll find these other areas amplify all the good work you’ve already done.
In particular, building a healthy generative culture is a crucial step to take if you want to reach the best levels of performance. And if you want to succeed, increasing your user-centricity powers both product and organizational performance.
The research is so much deeper than just the metrics and all the reports produced to date remain relevant to software teams today. Read the latest DORA report.